05_maggio - Porto & diporto
05_maggio - Porto & diporto
05_maggio - Porto & diporto
- No tags were found...

You also want an ePaper? Increase the reach of your titles
YUMPU automatically turns print PDFs into web optimized ePapers that Google loves.
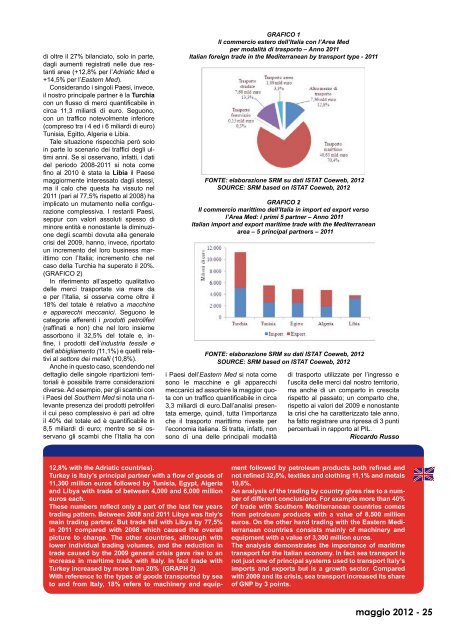
di oltre il 27% bilanciato, solo in parte,dagli aumenti registrati nelle due restantiaree (+12,8% per l’Adriatic Med e+14,5% per l’Eastern Med).Considerando i singoli Paesi, invece,il nostro principale partner è la Turchiacon un flusso di merci quantificabile incirca 11,3 miliardi di euro. Seguono,con un traffico notevolmente inferiore(compreso tra i 4 ed i 6 miliardi di euro)Tunisia, Egitto, Algeria e Libia.Tale situazione rispecchia però soloin parte lo scenario dei traffici degli ultimianni. Se si osservano, infatti, i datidel periodo 2008-2011 si nota comefino al 2010 è stata la Libia il Paese<strong>maggio</strong>rmente interessato dagli stessi,ma il calo che questa ha vissuto nel2011 (pari al 77,5% rispetto al 2008) haimplicato un mutamento nella configurazionecomplessiva. I restanti Paesi,seppur con valori assoluti spesso diminore entità e nonostante la diminuzionedegli scambi dovuta alla generalecrisi del 2009, hanno, invece, riportatoun incremento del loro business marittimocon l’Italia; incremento che nelcaso della Turchia ha superato il 20%.(GRAFICO 2)In riferimento all’aspetto qualitativodelle merci trasportate via mare dae per l’Italia, si osserva come oltre il18% del totale è relativo a macchinee apparecchi meccanici. Seguono lecategorie afferenti i prodotti petroliferi(raffinati e non) che nel loro insiemeassorbono il 32,5% del totale e, infine,i prodotti dell’industria tessile edell’abbigliamento (11,1%) e quelli relativial settore dei metalli (10,8%).Anche in questo caso, scendendo neldettaglio delle singole ripartizioni territorialiè possibile trarre considerazionidiverse. Ad esempio, per gli scambi coni Paesi del Southern Med si nota una rilevantepresenza dei prodotti petroliferiil cui peso complessivo è pari ad oltreil 40% del totale ed è quantificabile in8,5 miliardi di euro; mentre se si osservanogli scambi che l’Italia ha conGRAFICO 1Il commercio estero dell’Italia con l’Area Medper modalità di trasporto – Anno 2011Italian foreign trade in the Mediterranean by transport type - 2011FONTE: elaborazione SRM su dati ISTAT Coeweb, 2012SOURCE: SRM based on ISTAT Coeweb, 2012GRAFICO 2Il commercio marittimo dell’Italia in import ed export versol’Area Med: i primi 5 partner – Anno 2011Italian import and export maritime trade with the Mediterraneanarea – 5 principal partners – 2011FONTE: elaborazione SRM su dati ISTAT Coeweb, 2012SOURCE: SRM based on ISTAT Coeweb, 2012i Paesi dell’Eastern Med si nota comesono le macchine e gli apparecchimeccanici ad assorbire la <strong>maggio</strong>r quotacon un traffico quantificabile in circa3,3 miliardi di euro.Dall’analisi presentataemerge, quindi, tutta l’importanzache il trasporto marittimo riveste perl’economia italiana. Si tratta, infatti, nonsono di una delle principali modalitàdi trasporto utilizzate per l’ingresso el’uscita delle merci dal nostro territorio,ma anche di un comparto in crescitarispetto al passato; un comparto che,rispetto ai valori del 2009 e nonostantela crisi che ha caratterizzato tale anno,ha fatto registrare una ripresa di 3 puntipercentuali in rapporto al PIL.Riccardo Russo12,8% with the Adriatic countries).Turkey is Italy’s principal partner with a flow of goods of11,300 million euros followed by Tunisia, Egypt, Algeriaand Libya with trade of between 4,000 and 6,000 millioneuros each.These numbers reflect only a part of the last few yearstrading pattern. Between 2008 and 2011 Libya was Italy’smain trading partner. But trade fell with Libya by 77,5%in 2011 compared with 2008 which caused the overallpicture to change. The other countries, although withlower individual trading volumes, and the reduction intrade caused by the 2009 general crisis gave rise to anincrease in maritime trade with Italy. In fact trade withTurkey increased by more than 20% (GRAPH 2)With reference to the types of goods transported by seato and from Italy, 18% refers to machinery and equipmentfollowed by petroleum products both refined andnot refined 32,5%, textiles and clothing 11,1% and metals10,8%.An analysis of the trading by country gives rise to a numberof different conclusions. For example more than 40%of trade with Southern Mediterranean countries comesfrom petroleum products with a value of 8,500 millioneuros. On the other hand trading with the Eastern Mediterraneancountries consists mainly of machinery andequipment with a value of 3,300 million euros.The analysis demonstrates the importance of maritimetransport for the Italian economy. In fact sea transport isnot just one of principal systems used to transport Italy’simports and exports but is a growth sector. Comparedwith 2009 and its crisis, sea transport increased its shareof GNP by 3 points.<strong>maggio</strong> 2012 - 25