O Turismo em 2008 - Turismo de Portugal
O Turismo em 2008 - Turismo de Portugal
O Turismo em 2008 - Turismo de Portugal

You also want an ePaper? Increase the reach of your titles
YUMPU automatically turns print PDFs into web optimized ePapers that Google loves.
POrTugal cOmO <strong>de</strong>sTinO TurÍsTicO<br />
Principais indicadores <strong>de</strong> Performance<br />
Em <strong>2008</strong> existiam <strong>em</strong> <strong>Portugal</strong> 2.041 estabelecimen‑<br />
tos hoteleiros, al<strong>de</strong>amentos e apartamentos turísticos,<br />
com uma capacida<strong>de</strong> <strong>de</strong> 273.975 camas, o que, <strong>em</strong><br />
relação ao ano <strong>de</strong> 2007, representa um aumento <strong>de</strong><br />
9 estabelecimentos e 3,5% das camas. Relativamente<br />
às outras tipologias <strong>de</strong> <strong>em</strong>preendimentos turísticos,<br />
<strong>Portugal</strong> dispunha <strong>de</strong> 1.047 estabelecimentos <strong>de</strong> Turis‑<br />
mo <strong>de</strong> Habitação e <strong>Turismo</strong> no Espaço Rural com<br />
11.692 camas e <strong>de</strong> 229 Parques <strong>de</strong> Campismo <strong>em</strong><br />
funcionamento, com capacida<strong>de</strong> para alojar 185.302<br />
campistas.<br />
capacida<strong>de</strong>* (<strong>em</strong> camas)<br />
áreas regionais <strong>de</strong> <strong>Turismo</strong> e regiões autónomas <strong>2008</strong><br />
PORTugAL COMO DESTiNO TuRíSTiCO • 30<br />
Incidindo a análise exclusivamente sobre o número <strong>de</strong><br />
camas dos estabelecimentos hoteleiros, al<strong>de</strong>amentos<br />
e apartamentos turísticos, por ser o mais representati‑<br />
vo, constatou ‑se que 74% da oferta <strong>de</strong> camas do país<br />
se concentram nas Áreas Regionais <strong>de</strong> <strong>Turismo</strong> (ART)<br />
do Algarve, Lisboa e Vale do Tejo e Norte. Todas as ART<br />
apresentaram acréscimos significativos face a 2007.<br />
Os maiores aumentos relativos <strong>de</strong> capacida<strong>de</strong> regis‑<br />
taram ‑se na ART Norte e na Região Autónoma da<br />
Ma<strong>de</strong>ira, com 6,6% e 4,4%, respectivamente.<br />
∆ Abs.<br />
08/07<br />
quota<br />
%<br />
Norte 38.817 2.396 14,2<br />
Centro 24.524 544 9,0<br />
Lisboa e Vale do Tejo 65.895 2.227 24,1<br />
Alentejo 8.853 49 3,2<br />
Algarve 98.724 2.544 36,0<br />
R. A. Açores 8.662 265 3,2<br />
R. A. Ma<strong>de</strong>ira 28.500 1.203 10,4<br />
Total 273.975 9.228 100,0<br />
* <strong>em</strong> estabelecimentos hoteleiros, al<strong>de</strong>amentos e apartamentos turísticos<br />
FONTE: iNE – instituto Nacional <strong>de</strong> Estatística<br />
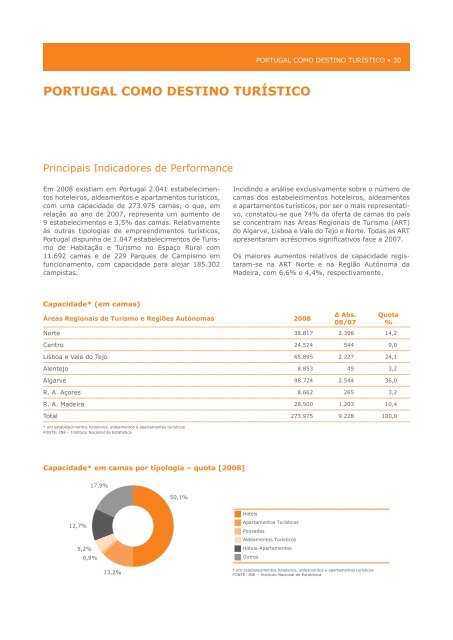
capacida<strong>de</strong>* <strong>em</strong> camas por tipologia – quota [<strong>2008</strong>]<br />
12,7%<br />
5,2%<br />
0,9%<br />
17,9%<br />
13,2%<br />
50,1%<br />
Hotéis<br />
Apartamentos Turísticos<br />
Pousadas<br />
Al<strong>de</strong>amentos Turísticos<br />
Hóteis-Apartamentos<br />
Outros<br />
* <strong>em</strong> estabelecimentos hoteleiros, al<strong>de</strong>amentos e apartamentos turísticos<br />
FONTE: INE – Instituto Nacional <strong>de</strong> Estatística