O Turismo em 2008 - Turismo de Portugal
O Turismo em 2008 - Turismo de Portugal
O Turismo em 2008 - Turismo de Portugal

You also want an ePaper? Increase the reach of your titles
YUMPU automatically turns print PDFs into web optimized ePapers that Google loves.
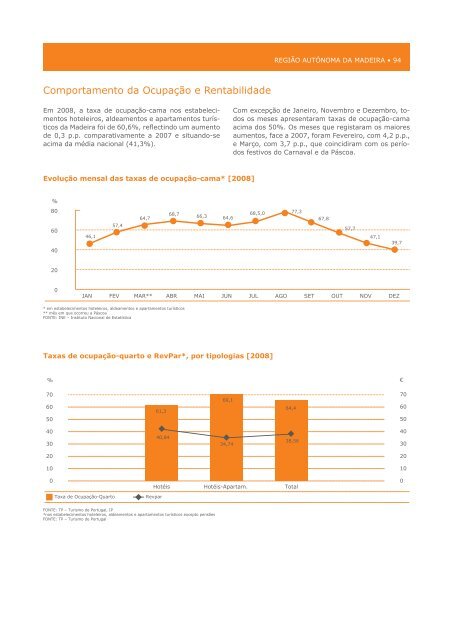
Comportamento da Ocupação e Rentabilida<strong>de</strong><br />
Em <strong>2008</strong>, a taxa <strong>de</strong> ocupação ‑cama nos estabeleci‑<br />
mentos hoteleiros, al<strong>de</strong>amentos e apartamentos turís‑<br />
ticos da Ma<strong>de</strong>ira foi <strong>de</strong> 60,6%, reflectindo um aumento<br />
<strong>de</strong> 0,3 p.p. comparativamente a 2007 e situando ‑se<br />
acima % da média nacional (41,3%).<br />
80<br />
57,4<br />
60<br />
evolução mensal 46,1 das taxas <strong>de</strong> ocupação-cama* [<strong>2008</strong>]<br />
40<br />
%<br />
80 20<br />
600<br />
* <strong>em</strong> 40 estabelecimentos hoteleiros, al<strong>de</strong>amentos e apartamentos turísticos<br />
** mês <strong>em</strong> que ocorreu a Páscoa<br />
FONTE: INE – Instituto Nacional <strong>de</strong> Estatística<br />
20<br />
0<br />
57,4<br />
64,7<br />
68,7<br />
* <strong>em</strong> estabelecimentos hoteleiros, al<strong>de</strong>amentos e apartamentos turísticos<br />
** mês <strong>em</strong> que ocorreu a Páscoa<br />
FONTE: INE – Instituto Nacional <strong>de</strong> Estatística<br />
0<br />
66,3<br />
64,6<br />
REgiãO AuTóNOMA DA MADEiRA • 94<br />
Com excepção <strong>de</strong> Janeiro, Nov<strong>em</strong>bro e Dez<strong>em</strong>bro, to‑<br />
dos os meses apresentaram taxas <strong>de</strong> ocupação ‑cama<br />
acima dos 50%. Os meses que registaram os maiores<br />
aumentos, face a 2007, foram Fevereiro, com 4,2 p.p.,<br />
e Março, com 3,7 p.p., que coincidiram com os perío‑<br />
dos festivos do Carnaval e da Páscoa.<br />
JAN<br />
46,1<br />
FEV MAR** ABR MAI JUN JUL AGO SET OUT NOV47,1 DEZ<br />
39,7<br />
JAN FEV MAR** ABR MAI JUN JUL AGO SET OUT NOV DEZ<br />
40<br />
40<br />
%<br />
30<br />
40,84<br />
34,74<br />
38,56<br />
€<br />
30<br />
70<br />
20<br />
69,1<br />
70<br />
20<br />
60<br />
10<br />
61,3<br />
64,4<br />
60<br />
10<br />
50<br />
0<br />
50<br />
0<br />
40<br />
Hotéis Hotéis-Apartam.<br />
Total<br />
40<br />
Taxa <strong>de</strong> Ocupação-Quarto<br />
30<br />
Revpar<br />
40,84<br />
34,74<br />
38,56<br />
30<br />
FONTE: TP – <strong>Turismo</strong> <strong>de</strong> <strong>Portugal</strong>, IP<br />
*nos 20estabelecimentos<br />
hoteleiros, al<strong>de</strong>amentos e apartamentos turísticos excepto pensões<br />
FONTE: TP – <strong>Turismo</strong> <strong>de</strong> <strong>Portugal</strong><br />
20<br />
10<br />
10<br />
Taxa <strong>de</strong> Ocupação-Quarto<br />
64,7<br />
Hotéis Hotéis-Apartam.<br />
Revpar<br />
68,7<br />
66,3<br />
FONTE: TP – <strong>Turismo</strong> <strong>de</strong> <strong>Portugal</strong>, IP<br />
*nos estabelecimentos hoteleiros, al<strong>de</strong>amentos e apartamentos turísticos excepto pensões<br />
FONTE: TP – <strong>Turismo</strong> <strong>de</strong> <strong>Portugal</strong><br />
64,6<br />
68,5,0<br />
68,5,0<br />
Taxas <strong>de</strong> ocupação-quarto e revPar*, por tipologias [<strong>2008</strong>]<br />
% €<br />
70<br />
60<br />
50<br />
61,3<br />
69,1<br />
64,4<br />
77,3<br />
77,3<br />
Total<br />
67,8<br />
67,8<br />
57,7<br />
57,7<br />
47,1<br />
39,7<br />
70<br />
60<br />
50<br />
0