O Turismo em 2008 - Turismo de Portugal
O Turismo em 2008 - Turismo de Portugal
O Turismo em 2008 - Turismo de Portugal

You also want an ePaper? Increase the reach of your titles
YUMPU automatically turns print PDFs into web optimized ePapers that Google loves.
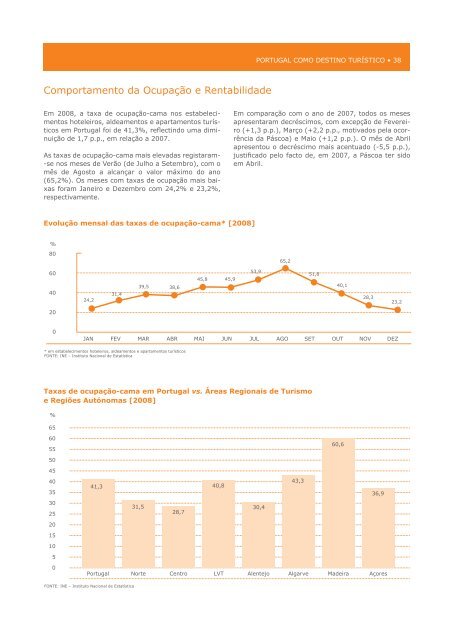
Comportamento da Ocupação e Rentabilida<strong>de</strong><br />
Em <strong>2008</strong>, a taxa <strong>de</strong> ocupação ‑cama nos estabeleci‑<br />
mentos hoteleiros, al<strong>de</strong>amentos e apartamentos turís‑<br />
ticos <strong>em</strong> <strong>Portugal</strong> foi <strong>de</strong> 41,3%, reflectindo uma dimi‑<br />
nuição <strong>de</strong> 1,7 p.p., <strong>em</strong> relação a 2007.<br />
As taxas <strong>de</strong> ocupação ‑cama mais elevadas registaram‑<br />
‑se nos meses <strong>de</strong> Verão (<strong>de</strong> Julho a Set<strong>em</strong>bro), com o<br />
mês <strong>de</strong> Agosto a alcançar o valor máximo do ano<br />
(65,2%). Os meses com taxas <strong>de</strong> ocupação mais bai‑<br />
xas foram Janeiro e Dez<strong>em</strong>bro com 24,2% e 23,2%,<br />
respectivamente.<br />
evolução mensal das taxas <strong>de</strong> ocupação-cama* [<strong>2008</strong>]<br />
%<br />
80<br />
%<br />
80<br />
60<br />
60<br />
40<br />
40<br />
20<br />
24,2<br />
24,2<br />
31,4<br />
31,4<br />
39,5<br />
39,5<br />
38,6<br />
38,6<br />
45,8<br />
45,9<br />
PORTugAL COMO DESTiNO TuRíSTiCO • 38<br />
Em comparação com o ano <strong>de</strong> 2007, todos os meses<br />
apresentaram <strong>de</strong>créscimos, com excepção <strong>de</strong> Feverei‑<br />
ro (+1,3 p.p.), Março (+2,2 p.p., motivados pela ocor‑<br />
rência da Páscoa) e Maio (+1,2 p.p.). O mês <strong>de</strong> Abril<br />
apresentou o <strong>de</strong>créscimo mais acentuado ( ‑5,5 p.p.),<br />
justificado pelo facto <strong>de</strong>, <strong>em</strong> 2007, a Páscoa ter sido<br />
<strong>em</strong> Abril.<br />
20<br />
0<br />
JAN FEV MAR ABR MAI JUN JUL AGO SET OUT NOV DEZ<br />
0<br />
* <strong>em</strong> estabelecimentos JANhoteleiros, FEV al<strong>de</strong>amentos e MAR apartamentos ABR turísticos<br />
FONTE: INE – Instituto Nacional <strong>de</strong> Estatística<br />
MAI JUN JUL AGO SET OUT NOV DEZ<br />
* <strong>em</strong> estabelecimentos hoteleiros, al<strong>de</strong>amentos e apartamentos turísticos<br />
FONTE: INE – Instituto Nacional <strong>de</strong> Estatística<br />
Taxas <strong>de</strong> ocupação-cama <strong>em</strong> <strong>Portugal</strong> vs. áreas regionais <strong>de</strong> <strong>Turismo</strong><br />
e % regiões autónomas [<strong>2008</strong>]<br />
45,8<br />
65 %<br />
60 65<br />
55 60<br />
60,6<br />
50 55<br />
45 50<br />
60,6<br />
40 45<br />
41,3<br />
40,8<br />
43,3<br />
35 40<br />
30 35<br />
25 30<br />
20 25<br />
15 20<br />
10 15<br />
105<br />
41,3<br />
31,5<br />
31,5<br />
28,7<br />
28,7<br />
40,8<br />
30,4<br />
30,4<br />
43,3<br />
36,9<br />
36,9<br />
05<br />
0<br />
<strong>Portugal</strong> Norte Centro LVT Alentejo Algarve Ma<strong>de</strong>ira Açores<br />
FONTE: INE – Instituto <strong>Portugal</strong> Nacional <strong>de</strong> Estatística Norte Centro LVT Alentejo Algarve Ma<strong>de</strong>ira Açores<br />
FONTE: INE – Instituto Nacional <strong>de</strong> Estatística<br />
45,9<br />
53,9<br />
53,9<br />
65,2<br />
65,2<br />
51,8<br />
51,8<br />
40,1<br />
40,1<br />
28,3<br />
28,3<br />
23,2<br />
23,2