O Turismo em 2008 - Turismo de Portugal
O Turismo em 2008 - Turismo de Portugal
O Turismo em 2008 - Turismo de Portugal

You also want an ePaper? Increase the reach of your titles
YUMPU automatically turns print PDFs into web optimized ePapers that Google loves.
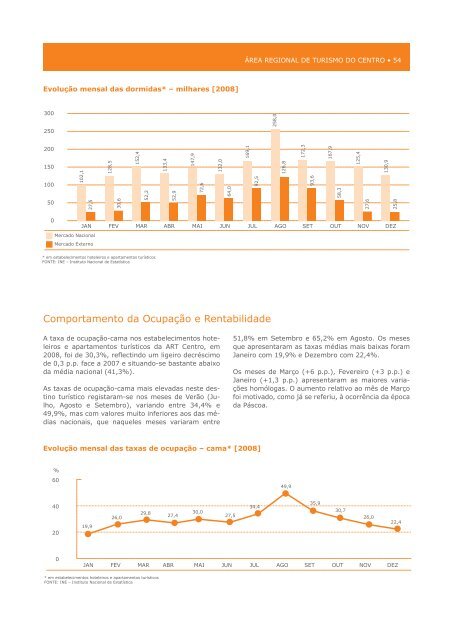
evolução mensal das dormidas* – milhares [<strong>2008</strong>]<br />
300<br />
250<br />
200<br />
150<br />
100<br />
50<br />
0<br />
Comportamento da Ocupação e Rentabilida<strong>de</strong><br />
A taxa <strong>de</strong> ocupação ‑cama nos estabelecimentos hote‑<br />
leiros e apartamentos turísticos da ART Centro, <strong>em</strong><br />
<strong>2008</strong>, foi <strong>de</strong> 30,3%, reflectindo um ligeiro <strong>de</strong>créscimo<br />
<strong>de</strong> 0,3 p.p. face a 2007 e situando ‑se bastante abaixo<br />
da média nacional (41,3%).<br />
As taxas <strong>de</strong> ocupação ‑cama mais elevadas neste <strong>de</strong>s‑<br />
tino turístico registaram ‑se nos meses <strong>de</strong> Verão (Ju‑<br />
lho, Agosto e Set<strong>em</strong>bro), variando entre 34,4% e<br />
49,9%, mas com valores muito inferiores aos das mé‑<br />
dias nacionais, que naqueles meses variaram entre<br />
evolução mensal das taxas <strong>de</strong> ocupação – cama* [<strong>2008</strong>]<br />
%<br />
60<br />
40<br />
20<br />
0<br />
102,1<br />
27,5<br />
Mercado Nacional<br />
Mercado Externo<br />
19,9<br />
128,5<br />
30,6<br />
26,0<br />
152,4<br />
52,2<br />
* <strong>em</strong> estabelecimentos hoteleiros e apartamentos turísticos<br />
FONTE: INE – Instituto Nacional <strong>de</strong> Estatística<br />
29,8<br />
* <strong>em</strong> estabelecimentos hoteleiros e apartamentos turísticos<br />
FONTE: INE – Instituto Nacional <strong>de</strong> Estatística<br />
133,4<br />
52,9<br />
27,4<br />
147,9<br />
72,6<br />
30,0<br />
132,0<br />
64,0<br />
27,5<br />
ÁREA REgiONAL DE TuRiSMO DO CENTRO • 54<br />
JAN FEV MAR ABR MAI JUN JUL AGO SET OUT NOV DEZ<br />
51,8% <strong>em</strong> Set<strong>em</strong>bro e 65,2% <strong>em</strong> Agosto. Os meses<br />
que apresentaram as taxas médias mais baixas foram<br />
Janeiro com 19,9% e Dez<strong>em</strong>bro com 22,4%.<br />
Os meses <strong>de</strong> Março (+6 p.p.), Fevereiro (+3 p.p.) e<br />
Janeiro (+1,3 p.p.) apresentaram as maiores varia‑<br />
ções homólogas. O aumento relativo ao mês <strong>de</strong> Março<br />
foi motivado, como já se referiu, à ocorrência da época<br />
da Páscoa.<br />
JAN FEV MAR ABR MAI JUN JUL AGO SET OUT NOV DEZ<br />
169,1<br />
92,5<br />
34,4<br />
258,0<br />
126,8<br />
49,9<br />
172,3<br />
93,6<br />
35,9<br />
167,9<br />
58,3<br />
30,7<br />
125,4<br />
27,6<br />
26,0<br />
130,9<br />
25,8<br />
22,4