- Page 1 and 2:
ANAIS
- Page 3 and 4:
Mensagem da Coordenação Geral O S
- Page 5 and 6:
Mensagem da Coordenadora do WTICG M
- Page 7 and 8:
Comitê de Programa e Revisores do
- Page 9 and 10:
Comitê de Programa e Revisores do
- Page 11 and 12:
Detecção de Intrusos usando Conju
- Page 13 and 14:
Sumário dos Anais WGID Avaliação
- Page 15 and 16:
Um Mecanismo de Proteção de Quadr
- Page 17 and 18:
apresenta os trabalhos relacionados
- Page 19 and 20:
o descarte de qualquer quadro com n
- Page 21 and 22:
1, a mesma apresenta diversas vulne
- Page 23 and 24:
locos com menos de 128 bits devem s
- Page 25 and 26:
RTS CTS ACK BA BAR PS- Poll CF- End
- Page 27 and 28:
Cam-Winget, N., Smith, D., and Walk
- Page 29 and 30:
Tratamento Automatizado de Incident
- Page 31 and 32:
Diante deste cenário de problemas
- Page 33 and 34:
Figura 1. Visão geral da arquitetu
- Page 35 and 36:
5. Caso o módulo de Contenção es
- Page 37 and 38:
de implantação consiste basicamen
- Page 39 and 40:
Identificação de máquinas reinci
- Page 41 and 42:
6. Considerações finais Este trab
- Page 43 and 44:
Uma Ontologia para Mitigar XML Inje
- Page 45 and 46:
2. Ontologia Uma ontologia descreve
- Page 47 and 48:
classe de ataque baseando-se nas es
- Page 49 and 50:
Cross-Site Scripting. O sniffer Wir
- Page 51 and 52:
elacionando as mesmas com instânci
- Page 53 and 54:
diferente do que foi definido será
- Page 55 and 56:
os algoritmos e os mecanismos de de
- Page 57 and 58:
Carimbos do Tempo Autenticados para
- Page 59 and 60:
Atestes da validade de assinaturas,
- Page 61 and 62:
4. Carimbos do Tempo Autenticados N
- Page 63 and 64:
U −→ ACT : H(ts) ACT −→ U :
- Page 65 and 66:
5.1. Custos na Preservação e Vali
- Page 67 and 68:
Nas simulações, os custos de arma
- Page 69 and 70:
6. Conclusões O uso de documentos
- Page 71 and 72:
SCuP - Secure Cryptographic Micropr
- Page 73 and 74:
adversário para copiar alguns arqu
- Page 75 and 76:
Com o uso de uma motherboard com do
- Page 77 and 78:
A arquitetura do SCuP mostrando os
- Page 79 and 80:
3.1.5. Outros Componentes O SCuP po
- Page 81 and 82:
Com a arquitetura do SCuP, a verifi
- Page 83 and 84:
[2] Benjie Chen and Robert Morris.
- Page 85 and 86:
Fault Attacks against a Cellular Au
- Page 87 and 88:
2. Fault Analysis of the Rule 30 St
- Page 89 and 90:
• This configuration is only poss
- Page 91 and 92:
• This configuration is only poss
- Page 93 and 94:
3.1. Fault Analysis Effect on Rule
- Page 95 and 96:
Zero-knowledge Identification based
- Page 97 and 98:
strings. It is computationally bind
- Page 99 and 100:
Stern’s Identification Scheme. Th
- Page 101 and 102:
FFT, the application of ideal latti
- Page 103 and 104:
ut with similar images through the
- Page 105 and 106:
public keys. This ensures that the
- Page 107 and 108:
Véron, P. (1996). Improved identif
- Page 109 and 110:
adversary may arbitrarily deviate f
- Page 111 and 112:
Let f an ideal oblivious transfer f
- Page 113 and 114:
However, for the sake of brevity, w
- Page 115 and 116:
3. For every i for which r i = 1, B
- Page 117 and 118:
3. Upon receiving a valid decommitm
- Page 119 and 120:
protocol) or A 2 did not send valid
- Page 121 and 122:
Camenisch, J., Neven, G., and Shela
- Page 123 and 124:
timing of mouse movements and keyst
- Page 125 and 126:
Figure 1. Gilbert-Warshamov bound,
- Page 127 and 128:
Figure 2. Entropy allocation among
- Page 129 and 130:
Figure 3. Syndrome generating funct
- Page 131 and 132:
Figure 5. Syndrome-Fortuna operatio
- Page 133 and 134:
according to a defined demand level
- Page 135 and 136:
The proposed algorithm can be consi
- Page 137 and 138:
O objetivo deste artigo é propor u
- Page 139 and 140:
sistema de coleta de amostras de ma
- Page 141 and 142:
Fatores que afetam o comportamento
- Page 143 and 144:
2.1. O coletor de spam utilizado e
- Page 145 and 146:
de máquinas para implementar os 16
- Page 147 and 148:
spam aparece se faz passar por uma
- Page 149 and 150:
Para melhor entendermos o comportam
- Page 151 and 152:
normalmente menores, pode ser visua
- Page 153 and 154:
aperfeiçoamentos na técnica e atu
- Page 155 and 156:
Segmentação de Overlays P2P como
- Page 157 and 158:
em diversas máquinas de estados in
- Page 159 and 160:
overlay. Para fins de disponibilida
- Page 161 and 162:
espostas idênticas de membros dist
- Page 163 and 164:
3.1.3. Reconfiguração de Segmento
- Page 165 and 166:
chaves igual à união dos dois int
- Page 167 and 168:
5. Trabalhos Relacionados Rosebud [
- Page 169 and 170:
Rumo à Caracterização de Dissemi
- Page 171 and 172:
esponsável. Logo, essa “etiqueta
- Page 173 and 174:
conteúdo protegido por direito aut
- Page 175 and 176:
3.2. Instanciação da Arquitetura
- Page 177 and 178:
Tabela 3. Ranqueamento Usuário Tip
- Page 179 and 180:
fenômeno é observado quando uma f
- Page 181 and 182:
analisada. Até onde sabemos, este
- Page 183 and 184: Método Heurístico para Rotular Gr
- Page 185 and 186: mento foram considerados ataques em
- Page 187 and 188: amentas de varredura por vulnerabil
- Page 189 and 190: • Encontrar hosts que tornaram gr
- Page 191 and 192: Algoritmo 1 Cálculo do índice de
- Page 193 and 194: Cada linha da tabela 2 apresenta os
- Page 195 and 196: grupos densos e próximos aos grupo
- Page 197 and 198: Detecção de Intrusos usando Conju
- Page 199 and 200: mais comuns para a geração de con
- Page 201 and 202: freqüências de chamadas ao sistem
- Page 203 and 204: Diante das razões e definições d
- Page 205 and 206: conhecida na literatura de aprendiz
- Page 207 and 208: originalmente 41 características,
- Page 209 and 210: híbrida. É também importante des
- Page 211 and 212: Combinando Algoritmos de Classifica
- Page 213 and 214: apresenta a abordagem proposta. Na
- Page 215 and 216: utilização de mais de três níve
- Page 217 and 218: 4.3. Configuração 3 A última con
- Page 219 and 220: positivos (FPR - False Positive Rat
- Page 221 and 222: A Tabela 6 apresenta o percentual d
- Page 223 and 224: Como trabalhos futuros, é interess
- Page 225 and 226: Static Detection of Address Leaks G
- Page 227 and 228: 2. Background A buffer, also called
- Page 229 and 230: (Variables) ::= {v 1 , v 2 , . . .}
- Page 231 and 232: [LEAK] build edges(C, P t ) = E fin
- Page 233: (a) getad(v 0 , m 1 ) (b) v 0 → {
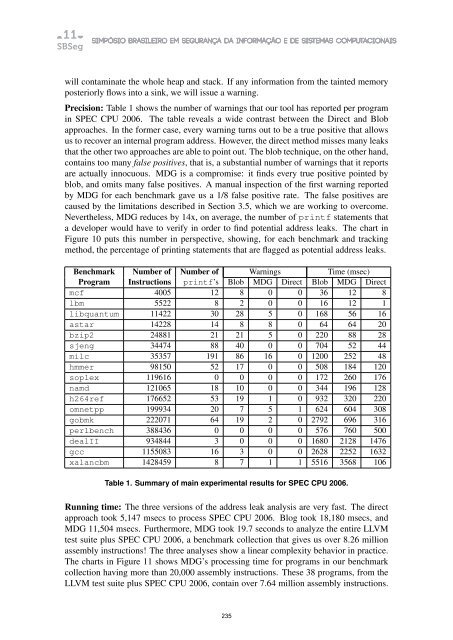
- Page 237 and 238: graph is built for each program poi
- Page 239 and 240: Um esquema bio-inspirado para a tol
- Page 241 and 242: mais de 80% da ação desses nós c
- Page 243 and 244: O esquema proposto é aplicado em s
- Page 245 and 246: Figura 2. Contagem de autoindutores
- Page 247 and 248: de PAN + QS 2 . O esquema foi avali
- Page 249 and 250: (a) Falta de cooperação (b) Tempo
- Page 251 and 252: (a) Taxa de detecção (b) Falsos n
- Page 253 and 254: Aumentando a segurança do MD6 em r
- Page 255 and 256: Tabela 1. Quantidade de deslocament
- Page 257 and 258: 2.2. Carga mínima de trabalho de u
- Page 259 and 260: nhos se formavam, identificamos alg
- Page 261 and 262: ela de deslocamento de bits não po
- Page 263 and 264: A tabela 5 mostra, para cada valor
- Page 265 and 266: Acordo de Chave Seguro contra Autor
- Page 267 and 268: 6 realizamos comparações com o no
- Page 269 and 270: Duas sessões são consideradas com
- Page 271 and 272: O cenário com pré-computação é
- Page 273 and 274: Tabela 2. Casos válidos de corromp
- Page 275 and 276: ReplacePublicKey(ID i , x i P ). Se
- Page 277 and 278: Tabela 4. Nomenclatura das variáve
- Page 279 and 280: WTICG 279
- Page 281 and 282: 1.1. Relevant Material Most existin
- Page 283 and 284: When designing a security-centric a
- Page 285 and 286:
3.3.1. Extraction Using Fourier tra
- Page 287 and 288:
4.1. Steganography Testing A variet
- Page 289 and 290:
Having implemented these steganogra
- Page 291 and 292:
para esses problemas através da im
- Page 293 and 294:
como os dados privados são armazen
- Page 295 and 296:
liberação de seus atributos; o Vi
- Page 297 and 298:
Foi então gerado um arquivo que co
- Page 299 and 300:
CulturaDigital (2011). Os rumos da
- Page 301 and 302:
das atividades que um malware efetu
- Page 303 and 304:
• A capacidade de manipular livre
- Page 305 and 306:
Tabela 1. Ações, tipos possíveis
- Page 307 and 308:
Figura 5. Espiral gerada através d
- Page 309 and 310:
Para validar a ferramenta, foram fe
- Page 311 and 312:
Este trabalho tem como objetivo pro
- Page 313 and 314:
Figura 2. Modelo matemático de um
- Page 315 and 316:
diferentes representações interna
- Page 317 and 318:
ataque geométrico alternadamente [
- Page 319 and 320:
Figura 6. Número de mensagens troc
- Page 321 and 322:
pública do agente B. É também im
- Page 323 and 324:
Definição 2 Um ponto q é um par
- Page 325 and 326:
Dado um sistema especificado em PRO
- Page 327 and 328:
A partir destas mensagens é possí
- Page 329 and 330:
Uma Avaliação de Segurança no Ge
- Page 331 and 332:
2. Trabalhos Relacionados O gerenci
- Page 333 and 334:
(a) (b) (c) Figura 2. Comunicação
- Page 335 and 336:
4.2. Ataque contra ARP O objetivo d
- Page 337 and 338:
Para quaisquer cenários envolvendo
- Page 339 and 340:
A New Scheme for Anonymous Communic
- Page 341 and 342:
observations, the adversary may con
- Page 343 and 344:
carrier visited in a random route.
- Page 345 and 346:
When the gateway receives the acces
- Page 347 and 348:
data, such as the nodes’ secret p
- Page 349 and 350:
Avaliação do Impacto do Uso de Me
- Page 351 and 352:
A segurança em VANETs é um fator
- Page 353 and 354:
datagramas não confiável, não tr
- Page 355 and 356:
ecebimento das mensagens, o número
- Page 357 and 358:
1000 100 10 ECDSA DSA 1 0,1 Sem 0,0
- Page 359 and 360:
Uma Maneira Simples de Obter Regiõ
- Page 361 and 362:
emover as regiões que não contêm
- Page 363 and 364:
(a) (b) (c) (d) Figura 3: Passos do
- Page 365 and 366:
(a) (b) (c) (d) (e) (f) (g) (h) (i)
- Page 367 and 368:
Quatro parâmetros referentes aos f
- Page 369 and 370:
Análise e implementação de um pr
- Page 371 and 372:
• cabeçalho: Apresenta informaç
- Page 373 and 374:
TrustedRelAnn : : = SEQUENCE { c e
- Page 375 and 376:
primeiro modelo é conhecido como m
- Page 377 and 378:
WGID 377
- Page 379 and 380:
Entretanto, inúmeros desafios aind
- Page 381 and 382:
Em 2009, criou-se o Programa de Aud
- Page 383 and 384:
ações necessárias para a impleme
- Page 385 and 386:
(A) Se os controles de acesso são
- Page 387 and 388:
classificação do estágio atual e
- Page 389 and 390:
um usuário válido em um ambiente
- Page 391 and 392:
eduzir o número de mensagens de au
- Page 393 and 394:
O serviço de autenticação utiliz
- Page 395 and 396:
e obtenção de token Kerberos para
- Page 397 and 398:
Electronic Documents with Signature
- Page 399 and 400:
3. Authorization Constraints Paper
- Page 401 and 402:
the requirements, the document cann
- Page 403 and 404:
A creator signature, in comparison,
- Page 405 and 406:
Using Notary Based Public Key Infra
- Page 407 and 408:
egistered in the federation and per
- Page 409 and 410:
the verifier (user or service) or s
- Page 411 and 412:
IdP+ 5. Requests the certificate pr
- Page 413 and 414:
References Al-Riyami, S. and Paters