revista motricidade
revista motricidade
revista motricidade
- No tags were found...

You also want an ePaper? Increase the reach of your titles
YUMPU automatically turns print PDFs into web optimized ePapers that Google loves.
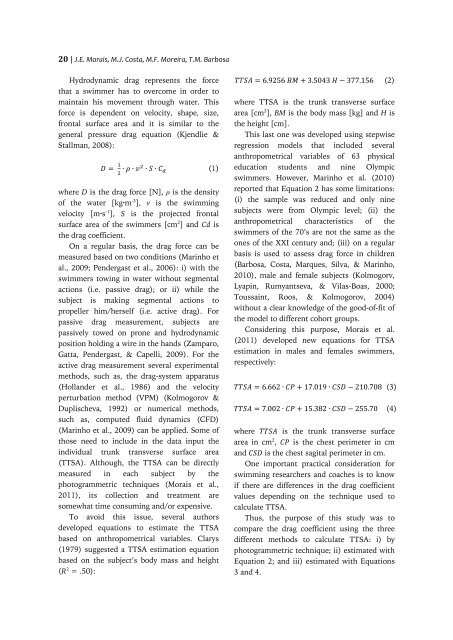
20 | J.E. Morais, M.J. Costa, M.F. Moreira, T.M. Barbosa<br />
Hydrodynamic drag represents the force<br />
that a swimmer has to overcome in order to<br />
maintain his movement through water. This<br />
force is dependent on velocity, shape, size,<br />
frontal surface area and it is similar to the<br />
general pressure drag equation (Kjendlie &<br />
Stallman, 2008):<br />
D = 1 2 ∙ ρ ∙ v2 ∙ S ∙ C d (1)<br />
where D is the drag force [N], ρ is the density<br />
of the water [kg·m -3 ], v is the swimming<br />
velocity [m·s -1 ], S is the projected frontal<br />
surface area of the swimmers [cm 2 ] and Cd is<br />
the drag coefficient.<br />
On a regular basis, the drag force can be<br />
measured based on two conditions (Marinho et<br />
al., 2009; Pendergast et al., 2006): i) with the<br />
swimmers towing in water without segmental<br />
actions (i.e. passive drag); or ii) while the<br />
subject is making segmental actions to<br />
propeller him/herself (i.e. active drag). For<br />
passive drag measurement, subjects are<br />
passively towed on prone and hydrodynamic<br />
position holding a wire in the hands (Zamparo,<br />
Gatta, Pendergast, & Capelli, 2009). For the<br />
active drag measurement several experimental<br />
methods, such as, the drag-system apparatus<br />
(Hollander et al., 1986) and the velocity<br />
perturbation method (VPM) (Kolmogorov &<br />
Duplischeva, 1992) or numerical methods,<br />
such as, computed fluid dynamics (CFD)<br />
(Marinho et al., 2009) can be applied. Some of<br />
those need to include in the data input the<br />
individual trunk transverse surface area<br />
(TTSA). Although, the TTSA can be directly<br />
measured in each subject by the<br />
photogrammetric techniques (Morais et al.,<br />
2011), its collection and treatment are<br />
somewhat time consuming and/or expensive.<br />
To avoid this issue, several authors<br />
developed equations to estimate the TTSA<br />
based on anthropometrical variables. Clarys<br />
(1979) suggested a TTSA estimation equation<br />
based on the subject’s body mass and height<br />
(R 2 = .50):<br />
TTSA = 6.9256 BM + 3.5043 H − 377.156 (2)<br />
where TTSA is the trunk transverse surface<br />
area [cm 2 ], BM is the body mass [kg] and H is<br />
the height [cm].<br />
This last one was developed using stepwise<br />
regression models that included several<br />
anthropometrical variables of 63 physical<br />
education students and nine Olympic<br />
swimmers. However, Marinho et al. (2010)<br />
reported that Equation 2 has some limitations:<br />
(i) the sample was reduced and only nine<br />
subjects were from Olympic level; (ii) the<br />
anthropometrical characteristics of the<br />
swimmers of the 70’s are not the same as the<br />
ones of the XXI century and; (iii) on a regular<br />
basis is used to assess drag force in children<br />
(Barbosa, Costa, Marques, Silva, & Marinho,<br />
2010), male and female subjects (Kolmogorv,<br />
Lyapin, Rumyantseva, & Vilas-Boas, 2000;<br />
Toussaint, Roos, & Kolmogorov, 2004)<br />
without a clear knowledge of the good-of-fit of<br />
the model to different cohort groups.<br />
Considering this purpose, Morais et al.<br />
(2011) developed new equations for TTSA<br />
estimation in males and females swimmers,<br />
respectively:<br />
TTSA = 6.662 ∙ CP + 17.019 ∙ CSD − 210.708 (3)<br />
TTSA = 7.002 ∙ CP + 15.382 ∙ CSD − 255.70 (4)<br />
where TTSA is the trunk transverse surface<br />
area in cm 2 , CP is the chest perimeter in cm<br />
and CSD is the chest sagital perimeter in cm.<br />
One important practical consideration for<br />
swimming researchers and coaches is to know<br />
if there are differences in the drag coefficient<br />
values depending on the technique used to<br />
calculate TTSA.<br />
Thus, the purpose of this study was to<br />
compare the drag coefficient using the three<br />
different methods to calculate TTSA: i) by<br />
photogrammetric technique; ii) estimated with<br />
Equation 2; and iii) estimated with Equations<br />
3 and 4.