revista motricidade
revista motricidade
revista motricidade
- No tags were found...

You also want an ePaper? Increase the reach of your titles
YUMPU automatically turns print PDFs into web optimized ePapers that Google loves.
24 | J.E. Morais, M.J. Costa, M.F. Moreira, T.M. Barbosa<br />
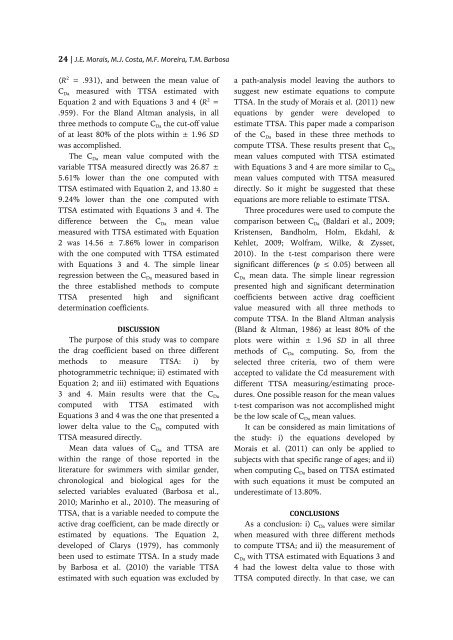
(R 2 = .931), and between the mean value of<br />
C Da measured with TTSA estimated with<br />
Equation 2 and with Equations 3 and 4 (R 2 =<br />
.959). For the Bland Altman analysis, in all<br />
three methods to compute C Da the cut-off value<br />
of at least 80% of the plots within ± 1.96 SD<br />
was accomplished.<br />
The C Da mean value computed with the<br />
variable TTSA measured directly was 26.87 ±<br />
5.61% lower than the one computed with<br />
TTSA estimated with Equation 2, and 13.80 ±<br />
9.24% lower than the one computed with<br />
TTSA estimated with Equations 3 and 4. The<br />
difference between the C Da mean value<br />
measured with TTSA estimated with Equation<br />
2 was 14.56 ± 7.86% lower in comparison<br />
with the one computed with TTSA estimated<br />
with Equations 3 and 4. The simple linear<br />
regression between the C Da measured based in<br />
the three established methods to compute<br />
TTSA presented high and significant<br />
determination coefficients.<br />
DISCUSSION<br />
The purpose of this study was to compare<br />
the drag coefficient based on three different<br />
methods to measure TTSA: i) by<br />
photogrammetric technique; ii) estimated with<br />
Equation 2; and iii) estimated with Equations<br />
3 and 4. Main results were that the C Da<br />
computed with TTSA estimated with<br />
Equations 3 and 4 was the one that presented a<br />
lower delta value to the C Da computed with<br />
TTSA measured directly.<br />
Mean data values of C Da and TTSA are<br />
within the range of those reported in the<br />
literature for swimmers with similar gender,<br />
chronological and biological ages for the<br />
selected variables evaluated (Barbosa et al.,<br />
2010; Marinho et al., 2010). The measuring of<br />
TTSA, that is a variable needed to compute the<br />
active drag coefficient, can be made directly or<br />
estimated by equations. The Equation 2,<br />
developed of Clarys (1979), has commonly<br />
been used to estimate TTSA. In a study made<br />
by Barbosa et al. (2010) the variable TTSA<br />
estimated with such equation was excluded by<br />
a path-analysis model leaving the authors to<br />
suggest new estimate equations to compute<br />
TTSA. In the study of Morais et al. (2011) new<br />
equations by gender were developed to<br />
estimate TTSA. This paper made a comparison<br />
of the C Da based in these three methods to<br />
compute TTSA. These results present that C Da<br />
mean values computed with TTSA estimated<br />
with Equations 3 and 4 are more similar to C Da<br />
mean values computed with TTSA measured<br />
directly. So it might be suggested that these<br />
equations are more reliable to estimate TTSA.<br />
Three procedures were used to compute the<br />
comparison between C Da (Baldari et al., 2009;<br />
Kristensen, Bandholm, Holm, Ekdahl, &<br />
Kehlet, 2009; Wolfram, Wilke, & Zysset,<br />
2010). In the t-test comparison there were<br />
significant differences (p ≤ 0.05) between all<br />
C Da mean data. The simple linear regression<br />
presented high and significant determination<br />
coefficients between active drag coefficient<br />
value measured with all three methods to<br />
compute TTSA. In the Bland Altman analysis<br />
(Bland & Altman, 1986) at least 80% of the<br />
plots were within ± 1.96 SD in all three<br />
methods of C Da computing. So, from the<br />
selected three criteria, two of them were<br />
accepted to validate the Cd measurement with<br />
different TTSA measuring/estimating procedures.<br />
One possible reason for the mean values<br />
t-test comparison was not accomplished might<br />
be the low scale of C Da mean values.<br />
It can be considered as main limitations of<br />
the study: i) the equations developed by<br />
Morais et al. (2011) can only be applied to<br />
subjects with that specific range of ages; and ii)<br />
when computing C Da based on TTSA estimated<br />
with such equations it must be computed an<br />
underestimate of 13.80%.<br />
CONCLUSIONS<br />
As a conclusion: i) C Da values were similar<br />
when measured with three different methods<br />
to compute TTSA; and ii) the measurement of<br />
C Da with TTSA estimated with Equations 3 and<br />
4 had the lowest delta value to those with<br />
TTSA computed directly. In that case, we can