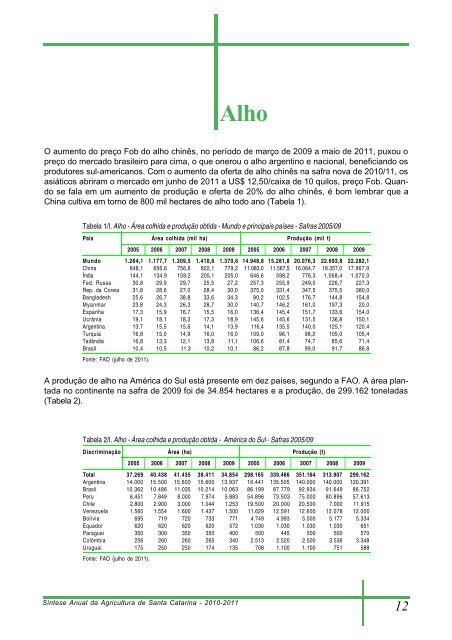
AlhoO aumento do preço Fob do alho chinês, no período <strong>de</strong> março <strong>de</strong> 2009 a maio <strong>de</strong> 2011, puxou opreço do mercado brasileiro para cima, o que onerou o alho argentino e nacional, beneficiando osprodutores sul-americanos. Com o aumento <strong>da</strong> oferta <strong>de</strong> alho chinês na safra nova <strong>de</strong> 2010/11, osasiáticos abriram o mercado em junho <strong>de</strong> 2011 a US$ 12,50/caixa <strong>de</strong> 10 quilos, preço Fob. Quandose fala em um aumento <strong>de</strong> produção e oferta <strong>de</strong> 20% do alho chinês, é bom lembrar que aChina cultiva em torno <strong>de</strong> 800 mil hectares <strong>de</strong> alho todo ano (Tabela 1).Tabela 1/I. Alho - Área colhi<strong>da</strong> e produção obti<strong>da</strong> - Mundo e principais países - Safras 2005/09Pais Área colhi<strong>da</strong> (mil ha) Produção (mil t)2005 2006 2007 2008 2009 2005 2006 2007 2008 2009Mundo 1.264,1 1.177,7 1.309,5 1.410,6 1.370,6 14.948,8 15.281,8 20.076,3 22.693,8 22.282,1China 648,1 656,6 756,6 822,1 779,2 11.083,0 11.567,5 16.064,7 18.357,0 17.967,9Índia 144,1 134,9 159,2 205,1 205,0 646,6 598,2 776,3 1.068,4 1.070,0Fed. Russa 30,8 29,9 29,7 25,5 27,2 257,3 255,9 249,0 226,7 227,3Rep. <strong>da</strong> Coreia 31,8 28,6 27,0 28,4 30,0 375,0 331,4 347,5 375,5 380,0Bangla<strong>de</strong>sh 25,6 26,7 38,8 33,6 34,3 90,2 102,5 176,7 144,8 154,8Myanmar 23,8 24,3 26,3 28,7 30,0 140,7 146,2 161,0 197,3 20,0Espanha 17,3 15,9 16,7 15,5 16,0 136,4 145,4 151,7 133,6 154,0Ucrânia 19,1 18,1 18,3 17,3 18,9 145,6 145,6 131,5 136,8 150,1Argentina 13,7 15,5 15,6 14,1 13,9 116,4 135,5 140,0 125,1 120,4Turquia 16,8 15,0 14,9 16,0 16,0 109,0 96,1 98,2 105,0 105,4Tailândia 16,8 13,3 12,1 13,8 11,1 106,6 81,4 74,7 85,6 71,4Brasil 10,4 10,5 11,3 10,2 10,1 86,2 87,8 99,0 91,7 86,8Fonte: FAO (julho <strong>de</strong> 2011).A produção <strong>de</strong> alho na América do Sul está presente em <strong>de</strong>z países, segundo a FAO. A área planta<strong>da</strong>no continente na safra <strong>de</strong> 2009 foi <strong>de</strong> 34.854 hectares e a produção, <strong>de</strong> 299.162 tonela<strong>da</strong>s(Tabela 2).Tabela 2/I. Alho - Área colhi<strong>da</strong> e produção obti<strong>da</strong> - América do Sul - Safras 2005/09Discriminação Área (ha) Produção (t)2005 2006 2007 2008 2009 2005 2006 2007 2008 2009Total 37.269 40.438 41.435 38.411 34.854 298.165 339.466 351.164 313.907 299.162Argentina 14.000 15.500 15.600 15.600 13.937 16.441 135.505 140.000 140.000 120.391Brasil 10.362 10.486 11.035 10.214 10.063 86.199 87.779 92.934 91.649 86.752Peru 6.451 7.849 8.000 7.974 5.883 54.896 73.503 75.000 80.896 57.613Chile 2.800 2.900 3.000 1.044 1.253 19.500 20.000 20.500 7.000 11.915Venezuela 1.560 1.554 1.600 1.437 1.500 11.629 12.591 12.600 12.078 12.000Bolívia 695 719 720 733 771 4.749 4.993 5.000 5.177 5.334Equador 620 620 620 620 572 1.030 1.030 1.030 1.030 651Paraguai 350 300 350 350 400 500 445 500 500 570Colômbia 256 260 260 265 340 2.513 2.520 2.500 3.536 3.348Uruguai 175 250 250 174 135 708 1.100 1.100 751 588Fonte: FAO (julho <strong>de</strong> 2011).Síntese <strong>Anual</strong> <strong>da</strong> <strong>Agricultura</strong> <strong>de</strong> <strong>Santa</strong> <strong>Catarina</strong> - 2010-201112
AlhoOs países com maior área colhi<strong>da</strong> são Argentina, 13.937 hectares, segui<strong>da</strong> pelo Brasil, 10.063 hectares,Peru, 5.883 hectares e Chile com 1.253 hectares.Exceto a Argentina, que é o segundo maior exportador <strong>de</strong> alho do mundo, a produção dos <strong>de</strong>maispaíses <strong>da</strong> América do Sul é basicamente <strong>de</strong>stina<strong>da</strong> ao mercado interno. Dados extraoficiais vindos<strong>da</strong> Argentina dão conta também do aumento nas áreas <strong>de</strong> cultivo do alho na safra <strong>de</strong> 2010/11, acompanhandoa on<strong>da</strong> mundial, na faixa <strong>de</strong> <strong>de</strong>z por cento. A varie<strong>da</strong><strong>de</strong> com maior aumento <strong>de</strong> plantionos últimos anos é a <strong>de</strong> origem chinesa em <strong>de</strong>trimento ao alho nobre roxo que permanece estável.Produção e mercado nacionalA área colhi<strong>da</strong> e a produção <strong>da</strong>s safras brasileiras mostram que a cultura vem per<strong>de</strong>ndo espaço<strong>de</strong>s<strong>de</strong> meados dos anos 1990, quando o alho chinês <strong>de</strong>sembarcou no Brasil. Naquela época, plantavam-se<strong>de</strong>zoito mil hectares <strong>de</strong> alho, e o <strong>de</strong>staque ficava por conta <strong>de</strong> <strong>Santa</strong> <strong>Catarina</strong>, que cultivava4,4 mil hectares, ocupando o primeiro lugar entre os estados brasileiros.Nas safras <strong>de</strong> 2006 a 2009 (Tabela 3), as áreas <strong>de</strong> cultivo <strong>de</strong> alho no Brasil mostram um comportamentosimilar, ao redor dos <strong>de</strong>z mil hectares. Nesse período, o que cresceu foi a produtivi<strong>da</strong><strong>de</strong>média, que passou <strong>de</strong> 8,36 tonela<strong>da</strong>s por hectare em 2006 para 9,92 tonela<strong>da</strong>s em 2010.Dados preliminares <strong>da</strong> safra <strong>de</strong> 2011 indicam um pequeno aumento nas áreas <strong>de</strong> cultivo <strong>de</strong> alhoem todo o País. Esse aumento é <strong>de</strong>corrência do bom resultado econômico <strong>da</strong>s últimas três safras,quando os preços foram remuneradores.No Brasil existem duas regiões bem distintas responsáveis por 80% <strong>da</strong> área <strong>de</strong> plantio <strong>de</strong> alho,especialmente os nobres <strong>de</strong> <strong>de</strong>nte roxo, exigentes em frio e/ou fotoperíodo: o Sul do País, especialmentenos Campos <strong>de</strong> Curitibanos e na Serra Gaúcha; a outra região produtora é o “Cerrado” <strong>de</strong>Goiás, Minas Gerais e Bahia, on<strong>de</strong> os <strong>de</strong>staques são a Cristalina-Goiás, no Alto Paranaíba, SãoGotardo em Minas e a Chapa<strong>da</strong> Diamantina na Bahia. O alho produzido nessa região quente necessita<strong>de</strong> choque frio em câmaras frigoríficas e sua produção <strong>de</strong>stina-se aos gran<strong>de</strong>s centros consumidorese distribuidores do bulbo no Brasil.Os alhos comuns, com 15% <strong>da</strong> área cultiva<strong>da</strong> no Brasil, possuem uma baixa exigência <strong>de</strong> frio e/oufotoperíodo, baixa produtivi<strong>da</strong><strong>de</strong> média e produzem do Rio Gran<strong>de</strong> do Sul até o Nor<strong>de</strong>ste. Essesbulbos <strong>de</strong>stinam-se aos mercados regionais, que são menos exigentes em aparência e apresentação.A produção nacional <strong>de</strong> alho em 2010 foi <strong>de</strong> 104.586 tonela<strong>da</strong>s, volume superior ao ano anterior.Esse aumento <strong>da</strong> produtivi<strong>da</strong><strong>de</strong> <strong>de</strong>ve-se em gran<strong>de</strong> parte ao clima favorável à cultura e à altatecnologia usa<strong>da</strong> pelos produtores nacionais.Os estados <strong>de</strong> Goiás, Rio Gran<strong>de</strong> do Sul, <strong>Santa</strong> <strong>Catarina</strong> e Minas Gerais apresentaram as maioresáreas colhi<strong>da</strong>s do bulbo em 2010, com 2.671, 2.626, 1.767 e 1.635 hectares respectivamente(Tabela 3).Síntese <strong>Anual</strong> <strong>da</strong> <strong>Agricultura</strong> <strong>de</strong> <strong>Santa</strong> <strong>Catarina</strong> - 2010-201113
- Page 1 and 2: Síntese Anual da Agriculturade San
- Page 3 and 4: ApresentaçãoEsta é a 32ª ediç
- Page 5 and 6: SumárioParte IUma breve análise d
- Page 7 and 8: Uma breve análise da agropecuária
- Page 9 and 10: Tabela 2/I. Quantidade, preço, val
- Page 11: Alho - Concentração da produção
- Page 15 and 16: cessários na safra de 2011/12. Rec
- Page 17 and 18: AlhoPara a safra de 2011/12, que es
- Page 19 and 20: ArrozEmbora seja o segundo cereal m
- Page 21 and 22: ArrozO preço iniciou o ano de 2010
- Page 23 and 24: 01Banana - Concentração da produ
- Page 25 and 26: BananaSafra nacional 2010A safra na
- Page 27 and 28: Bananacontribuiu para que a produç
- Page 29 and 30: BananaO mercado estadual mantém um
- Page 31 and 32: CebolaNa última década a produç
- Page 33 and 34: CebolaO comportamento dos preços m
- Page 35 and 36: FeijãoNesta safra (2010/11) deve h
- Page 37 and 38: FeijãoTabela 5/I. Feijão - Área,
- Page 39 and 40: FeijãoCom relação ao balanço de
- Page 41 and 42: FumoTabela 2/I. Fumo - Principais p
- Page 43 and 44: FumoTabela 7/I. Fumo - Área, produ
- Page 45 and 46: Fumoços para a região como um tod
- Page 47 and 48: Maçã - Concentração da produç
- Page 49 and 50: MaçãDurante a safra ocorreram alg
- Page 51 and 52: MaçãTendo em vista as dificuldade
- Page 53 and 54: Produção agrícola - Mandioca por
- Page 55 and 56: MandiocaDurante a fase de desenvolv
- Page 57 and 58: MandiocaEm 2010, a venda catarinens
- Page 59 and 60: MilhoTabela 2/I. Milho - Principais
- Page 61 and 62: MilhoComo, no caso da soja e das ca
- Page 63 and 64:
MilhoTabela 13/I. Milho - Área, pr
- Page 65 and 66:
SojaO balanço de oferta e demanda
- Page 67 and 68:
Sojapara depois comprar de outros e
- Page 69 and 70:
Sojae seu preço mais alto em maio
- Page 71 and 72:
TomateNa América do Sul, o Brasil
- Page 73 and 74:
TomateO rendimento médio das lavou
- Page 75 and 76:
TomateÁguas Mornas com uma área d
- Page 77 and 78:
TrigoA China é o maior consumidor
- Page 79 and 80:
TrigoA maior concentração de cult
- Page 81 and 82:
TrigoNa safra 2010/11, as principai
- Page 83 and 84:
017,3%11,2%0203050459,4%09061114080
- Page 85 and 86:
Uva e vinhoTabela 2/I. Uva - Produ
- Page 87 and 88:
Uva e vinhoo vinho arraigado em sua
- Page 89 and 90:
Flores e plantasornamentaisGilberto
- Page 91 and 92:
Flores e plantasornamentaistos do a
- Page 93 and 94:
Perspectivas para as ornamentaisFlo
- Page 95 and 96:
HortifrutigranjeirosOs dados analis
- Page 97 and 98:
CalendárioAgrícolaProdutoAlhoArro
- Page 99 and 100:
Kong (terceiro importador) tem abas
- Page 101 and 102:
Carne bovinaTabela 7/I. Carne bovin
- Page 103 and 104:
Efetivo de frango por microrregiõe
- Page 105 and 106:
Carne de frangopara 7,5%; e Hong Ko
- Page 107 and 108:
Carne de frangoTabela 11 /I. Carne
- Page 109 and 110:
Efetivo de Suíno por microrregião
- Page 111 and 112:
Carne suínaTabela 4/I. Produção
- Page 113 and 114:
Carne suínaTabela 9/I. Carne suín
- Page 115 and 116:
Carne suínateceu recentemente em m
- Page 117 and 118:
Produção de origem animal - Leite
- Page 119 and 120:
Leitereal, que reduziu a competitiv
- Page 121 and 122:
Leitegrande parte provocada pela so
- Page 123 and 124:
LeiteCom a produção de leite dest
- Page 125 and 126:
Desempenho dapesca e daaquiculturaA
- Page 127 and 128:
Desempenho dapesca e daaquiculturaA
- Page 129 and 130:
Maricultura 5IntroduçãoDesempenho
- Page 131 and 132:
Desempenho dapesca e daaquiculturaO
- Page 133 and 134:
Desempenho dapesca e daaquiculturaE
- Page 135 and 136:
Desempenho dosetor florestalção p
- Page 137 and 138:
Desempenho dosetor florestalcomo im
- Page 139 and 140:
Desempenho dosetor florestalProduç
- Page 141 and 142:
Desempenho dosetor florestalFonte:
- Page 143 and 144:
Desempenho dosetor florestalEm 2010
- Page 145 and 146:
Desempenho dosetor florestalvendas
- Page 147 and 148:
Desempenho dosetor florestalProduç
- Page 149 and 150:
Desempenho dosetor florestalLenhaCa
- Page 151 and 152:
Desempenho dosetor florestalTabela
- Page 153 and 154:
Crédito ruralTabajara MarcondesEng
- Page 155 and 156:
Crédito ruralTabela 5/I. Pronaf -
- Page 157 and 158:
CréditofundiárioTabela 2/I. Evolu
- Page 159 and 160:
Divisão do territóriocatarinense
- Page 161 and 162:
Divisão do territóriocatarinense
- Page 163 and 164:
Divisão do territóriocatarinense
- Page 165 and 166:
Informações econômicasda agropec
- Page 167 and 168:
Informações econômicasda agropec
- Page 169:
Preços AgrícolasTabela 8/II. Pre
- Page 172 and 173:
Anexo IConceitosConsumo aparente de
- Page 174 and 175:
Lista de figuras- Parte IDesempenho
- Page 176 and 177:
Lista de tabelas- Parte ILista de t
- Page 178 and 179:
Lista de tabelas- Parte I7. Valor,
- Page 180 and 181:
Lista de tabelas- Parte ILeite1. Pr
- Page 182 and 183:
Índice remissivoAgricultura famili
- Page 184:
Síntese Anual da Agricultura de Sa