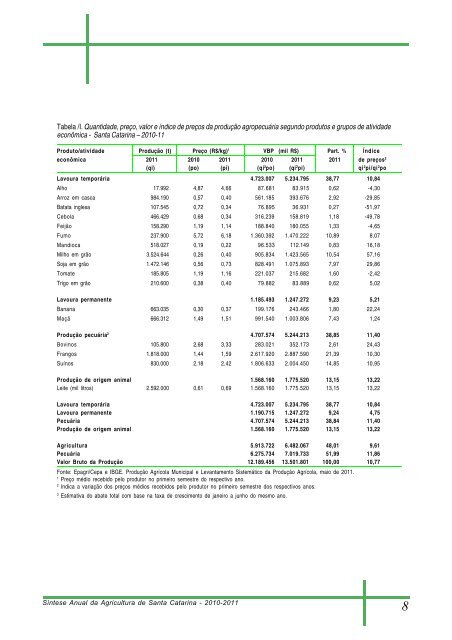
Tabela /I. Quanti<strong>da</strong><strong>de</strong>, preço, valor e índice <strong>de</strong> preços <strong>da</strong> produção agropecuária segundo produtos e grupos <strong>de</strong> ativi<strong>da</strong><strong>de</strong>econômica - <strong>Santa</strong> <strong>Catarina</strong> – 2010-11Produto/ativi<strong>da</strong><strong>de</strong> Produção (t) Preço (R$/kg) 1 VBP (mil R$) Part. % Índiceeconômica 2011 2010 2011 2010 2011 2011 <strong>de</strong> preços 2(qi) (po) (pi) (qi 2 po) (qi 2 pi) qi 2 pi/qi 2 poLavoura temporária 4.723.007 5.234.795 38,77 10,84Alho 17.992 4,87 4,66 87.681 83.915 0,62 -4,30Arroz em casca 984.190 0,57 0,40 561.185 393.676 2,92 -29,85Batata inglesa 107.545 0,72 0,34 76.895 36.931 0,27 -51,97Cebola 466.429 0,68 0,34 316.239 158.819 1,18 -49,78Feijão 158.290 1,19 1,14 188.840 180.055 1,33 -4,65Fumo 237.900 5,72 6,18 1.360.392 1.470.222 10,89 8,07Mandioca 518.027 0,19 0,22 96.533 112.149 0,83 16,18Milho em grão 3.524.644 0,26 0,40 905.834 1.423.565 10,54 57,16Soja em grão 1.472.146 0,56 0,73 828.491 1.075.893 7,97 29,86Tomate 185.805 1,19 1,16 221.037 215.682 1,60 -2,42Trigo em grão 210.600 0,38 0,40 79.882 83.889 0,62 5,02Lavoura permanente 1.185.493 1.247.272 9,23 5,21Banana 663.035 0,30 0,37 199.176 243.466 1,80 22,24Maçã 666.312 1,49 1,51 991.540 1.003.806 7,43 1,24Produção pecuária 3 4.707.574 5.244.213 38,85 11,40Bovinos 105.800 2,68 3,33 283.021 352.173 2,61 24,43Frangos 1.818.000 1,44 1,59 2.617.920 2.887.590 21,39 10,30Suínos 830.000 2,18 2,42 1.806.633 2.004.450 14,85 10,95Produção <strong>de</strong> origem animal 1.568.160 1.775.520 13,15 13,22Leite (mil litros) 2.592.000 0,61 0,69 1.568.160 1.775.520 13,15 13,22Lavoura temporária 4.723.007 5.234.795 38,77 10,84Lavoura permanente 1.190.715 1.247.272 9,24 4,75Pecuária 4.707.574 5.244.213 38,84 11,40Produção <strong>de</strong> origem animal 1.568.160 1.775.520 13,15 13,22<strong>Agricultura</strong> 5.913.722 6.482.067 48,01 9,61Pecuária 6.275.734 7.019.733 51,99 11,86Valor Bruto <strong>da</strong> Produção 12.189.456 13.501.801 100,00 10,77Fonte: Epagri/<strong>Cepa</strong> e IBGE. Produção Agrícola Municipal e Levantamento Sistemático <strong>da</strong> Produção Agrícola, maio <strong>de</strong> 2011.1Preço médio recebido pelo produtor no primeiro semestre do respectivo ano.2Indica a variação dos preços médios recebidos pelo produtor no primeiro semestre dos respectivos anos.3Estimativa do abate total com base na taxa <strong>de</strong> crescimento <strong>de</strong> janeiro a junho do mesmo ano.Síntese <strong>Anual</strong> <strong>da</strong> <strong>Agricultura</strong> <strong>de</strong> <strong>Santa</strong> <strong>Catarina</strong> - 2010-20118
Tabela 2/I. Quanti<strong>da</strong><strong>de</strong>, preço, valor e índice <strong>de</strong> Quantum <strong>da</strong> produção agropecuária, segundo produtos e grupos <strong>de</strong>ativi<strong>da</strong><strong>de</strong> econômica - <strong>Santa</strong> <strong>Catarina</strong> - 2010-11Produto/Ativi<strong>da</strong><strong>de</strong> Quantid. produzi<strong>da</strong> Preço Valor <strong>da</strong> produção 2011 Part.% Índiceeconômica (R$/kg) 1 (mil R$) <strong>de</strong>2010 2011 2010 2010 2011 2011 QuantumLavoura temporária 4.657.819 4.537.013 37,0 -2,59Alho 16.442 17.992 4,81 79.135 86.595 0,7 9,43Arroz em casca 1.041.587 984.190 0,56 579.843 547.891 4,5 -5,51Batata inglesa 105.373 107.545 0,47 49.501 50.521 0,4 2,06Cebola 537.521 466.429 0,64 341.444 296.285 2,4 -13,23Feijão em grão 169.753 158.290 1,09 185.710 173.169 1,4 -6,75Fumo (estufa) 243.474 237.900 5,68 1.382.932 1.351.272 11,0 -2,29Mandioca 541.476 518.027 0,19 102.880 98.425 0,8 -4,33Milho em grão 3.693.312 3.524.644 0,26 960.261 916.407 7,5 -4,57Soja em grão 1.374.045 1.472.146 0,54 741.984 794.959 6,5 7,14Tomate 186.802 185.805 0,75 140.102 139.354 1,1 -0,53Trigo em grão 241.093 210.600 0,39 94.026 82.134 0,7 -12,65Lavoura permanente 1.228.058 1.204.478 9,8 -1,92Banana 672.892 663.035 0,31 208.058 205.010 1,7 -1,46Maçã 680.000 666.312 1,50 1.020.000 999.468 8,2 -2,01Produção pecuária 2 4.786.044 4.925.576 40,2 2,92Bovinos 108.700 105.800 2,92 317.404 308.936 2,5 -2,67Frangos 1.723.000 1.818.000 1,43 2.463.890 2.599.740 21,2 5,51Suínos 825.000 830.000 2,43 2.004.750 2.016.900 16,5 0,61Produção <strong>de</strong> origem animal 1.464.000 1.581.120 12,9 8,00Leite (mil litros) 2.400.000 2.592.000 0,61 1.464.000 1.581.120 12,9 8,00<strong>Agricultura</strong> 5.885.877 5.741.491 46,9 -2,45Pecuária 6.250.044 6.506.696 53,1 4,11Total 12.135.921 12.248.187 100,0 0,93Fonte : Abipecs (Assoc. Brasileira <strong>da</strong> Indústria Produtora e Exportadora <strong>de</strong> Carnes Suína), UBA (União Brasileira <strong>de</strong> Avicultura), Abiec (Assoc.Brasileira <strong>da</strong>s Indústrias Exportadores <strong>de</strong> Carnes), IBGE, Produção Agrícola Municipal e Levantamento Sistemático <strong>da</strong> ProduçãoAgrícola, maio <strong>de</strong> 2011, IBGE. Produção Pecuária Municipal, Epagri/<strong>Cepa</strong>. Preços Recebidos pelo Agricultor.1Preço médio pon<strong>de</strong>rado recebido pelo produtor.2Produção total <strong>de</strong> carnes em <strong>Santa</strong> <strong>Catarina</strong>.Com relação às exportações catarinenses, em 2010 houve um crescimento <strong>de</strong> 17%. Embora, aprincípio, esse resultado pareça positivo, <strong>de</strong>ve-se levar em conta que o ano <strong>de</strong> comparação (2009)foi bastante ruim para o comércio exterior, já que estava em plena repercussão to<strong>da</strong> a crise econômicamundial inicia<strong>da</strong> em 2008. Portanto, a base <strong>de</strong> cálculo <strong>de</strong> 2009 estava inferior ao que oEstado normalmente exporta. Quando se toma um ano normal por base, como 2008, por exemplo,constata-se que o valor <strong>da</strong>s exportações catarinenses <strong>de</strong> 2010 <strong>de</strong>cresceu 8,8%: foram US$7,582 bilhões, em 2010, contra US$ 8,311 bilhões, em 2008.De 2009 para 2010, o valor <strong>da</strong>s exportações do agronegócio catarinense cresceu 14,8%; portanto,menos que os 17% observados no valor <strong>da</strong>s exportações totais. Por outro lado, houve uma que<strong>da</strong><strong>de</strong> 4,9% entre 2008 e 2010, que é explica<strong>da</strong> pelo aumento que ocorreu nos preços <strong>da</strong>s commoditiesagrícolas, já que em termos <strong>de</strong> quanti<strong>da</strong><strong>de</strong>, os embarques foram reduzidos.Nos primeiros <strong>de</strong>z meses <strong>de</strong> 2011, o valor <strong>da</strong>s exportações totais <strong>de</strong> <strong>Santa</strong> <strong>Catarina</strong> já superouem 18,7% o valor do mesmo período do ano anterior. No mesmo período, as exportações doSíntese <strong>Anual</strong> <strong>da</strong> <strong>Agricultura</strong> <strong>de</strong> <strong>Santa</strong> <strong>Catarina</strong> - 2010-20119
- Page 1 and 2: Síntese Anual da Agriculturade San
- Page 3 and 4: ApresentaçãoEsta é a 32ª ediç
- Page 5 and 6: SumárioParte IUma breve análise d
- Page 7: Uma breve análise da agropecuária
- Page 11 and 12: Alho - Concentração da produção
- Page 13 and 14: AlhoOs países com maior área colh
- Page 15 and 16: cessários na safra de 2011/12. Rec
- Page 17 and 18: AlhoPara a safra de 2011/12, que es
- Page 19 and 20: ArrozEmbora seja o segundo cereal m
- Page 21 and 22: ArrozO preço iniciou o ano de 2010
- Page 23 and 24: 01Banana - Concentração da produ
- Page 25 and 26: BananaSafra nacional 2010A safra na
- Page 27 and 28: Bananacontribuiu para que a produç
- Page 29 and 30: BananaO mercado estadual mantém um
- Page 31 and 32: CebolaNa última década a produç
- Page 33 and 34: CebolaO comportamento dos preços m
- Page 35 and 36: FeijãoNesta safra (2010/11) deve h
- Page 37 and 38: FeijãoTabela 5/I. Feijão - Área,
- Page 39 and 40: FeijãoCom relação ao balanço de
- Page 41 and 42: FumoTabela 2/I. Fumo - Principais p
- Page 43 and 44: FumoTabela 7/I. Fumo - Área, produ
- Page 45 and 46: Fumoços para a região como um tod
- Page 47 and 48: Maçã - Concentração da produç
- Page 49 and 50: MaçãDurante a safra ocorreram alg
- Page 51 and 52: MaçãTendo em vista as dificuldade
- Page 53 and 54: Produção agrícola - Mandioca por
- Page 55 and 56: MandiocaDurante a fase de desenvolv
- Page 57 and 58: MandiocaEm 2010, a venda catarinens
- Page 59 and 60:
MilhoTabela 2/I. Milho - Principais
- Page 61 and 62:
MilhoComo, no caso da soja e das ca
- Page 63 and 64:
MilhoTabela 13/I. Milho - Área, pr
- Page 65 and 66:
SojaO balanço de oferta e demanda
- Page 67 and 68:
Sojapara depois comprar de outros e
- Page 69 and 70:
Sojae seu preço mais alto em maio
- Page 71 and 72:
TomateNa América do Sul, o Brasil
- Page 73 and 74:
TomateO rendimento médio das lavou
- Page 75 and 76:
TomateÁguas Mornas com uma área d
- Page 77 and 78:
TrigoA China é o maior consumidor
- Page 79 and 80:
TrigoA maior concentração de cult
- Page 81 and 82:
TrigoNa safra 2010/11, as principai
- Page 83 and 84:
017,3%11,2%0203050459,4%09061114080
- Page 85 and 86:
Uva e vinhoTabela 2/I. Uva - Produ
- Page 87 and 88:
Uva e vinhoo vinho arraigado em sua
- Page 89 and 90:
Flores e plantasornamentaisGilberto
- Page 91 and 92:
Flores e plantasornamentaistos do a
- Page 93 and 94:
Perspectivas para as ornamentaisFlo
- Page 95 and 96:
HortifrutigranjeirosOs dados analis
- Page 97 and 98:
CalendárioAgrícolaProdutoAlhoArro
- Page 99 and 100:
Kong (terceiro importador) tem abas
- Page 101 and 102:
Carne bovinaTabela 7/I. Carne bovin
- Page 103 and 104:
Efetivo de frango por microrregiõe
- Page 105 and 106:
Carne de frangopara 7,5%; e Hong Ko
- Page 107 and 108:
Carne de frangoTabela 11 /I. Carne
- Page 109 and 110:
Efetivo de Suíno por microrregião
- Page 111 and 112:
Carne suínaTabela 4/I. Produção
- Page 113 and 114:
Carne suínaTabela 9/I. Carne suín
- Page 115 and 116:
Carne suínateceu recentemente em m
- Page 117 and 118:
Produção de origem animal - Leite
- Page 119 and 120:
Leitereal, que reduziu a competitiv
- Page 121 and 122:
Leitegrande parte provocada pela so
- Page 123 and 124:
LeiteCom a produção de leite dest
- Page 125 and 126:
Desempenho dapesca e daaquiculturaA
- Page 127 and 128:
Desempenho dapesca e daaquiculturaA
- Page 129 and 130:
Maricultura 5IntroduçãoDesempenho
- Page 131 and 132:
Desempenho dapesca e daaquiculturaO
- Page 133 and 134:
Desempenho dapesca e daaquiculturaE
- Page 135 and 136:
Desempenho dosetor florestalção p
- Page 137 and 138:
Desempenho dosetor florestalcomo im
- Page 139 and 140:
Desempenho dosetor florestalProduç
- Page 141 and 142:
Desempenho dosetor florestalFonte:
- Page 143 and 144:
Desempenho dosetor florestalEm 2010
- Page 145 and 146:
Desempenho dosetor florestalvendas
- Page 147 and 148:
Desempenho dosetor florestalProduç
- Page 149 and 150:
Desempenho dosetor florestalLenhaCa
- Page 151 and 152:
Desempenho dosetor florestalTabela
- Page 153 and 154:
Crédito ruralTabajara MarcondesEng
- Page 155 and 156:
Crédito ruralTabela 5/I. Pronaf -
- Page 157 and 158:
CréditofundiárioTabela 2/I. Evolu
- Page 159 and 160:
Divisão do territóriocatarinense
- Page 161 and 162:
Divisão do territóriocatarinense
- Page 163 and 164:
Divisão do territóriocatarinense
- Page 165 and 166:
Informações econômicasda agropec
- Page 167 and 168:
Informações econômicasda agropec
- Page 169:
Preços AgrícolasTabela 8/II. Pre
- Page 172 and 173:
Anexo IConceitosConsumo aparente de
- Page 174 and 175:
Lista de figuras- Parte IDesempenho
- Page 176 and 177:
Lista de tabelas- Parte ILista de t
- Page 178 and 179:
Lista de tabelas- Parte I7. Valor,
- Page 180 and 181:
Lista de tabelas- Parte ILeite1. Pr
- Page 182 and 183:
Índice remissivoAgricultura famili
- Page 184:
Síntese Anual da Agricultura de Sa