- Page 1:
SKOG TILL NYTTA FÖR ALLASkogsstati
- Page 5 and 6:
INNEHÅLLAtmosfäriskt nedfall, 5.7
- Page 7 and 8:
INNEHÅLLBegrepp och definitioner .
- Page 9 and 10:
INNEHÅLLAndel företag med skoglig
- Page 11 and 12:
INNEHÅLLSkogsmark och virkesförr
- Page 13 and 14:
CONTENTSThe Farm Register . . . . .
- Page 15 and 16:
CONTENTSTotal volume dead wood, 5.5
- Page 17 and 18:
CONTENTSAverage length of hauling d
- Page 19 and 20:
CONTENTSCollective wages and agreem
- Page 21 and 22:
CONTENTSLand area, population, area
- Page 23 and 24:
1SKOGLIG STATISTIKPRODUKTIONvudsyft
- Page 25 and 26:
1SKOGLIG STATISTIKPRODUKTIONpletter
- Page 27 and 28:
1SKOGLIG STATISTIKPRODUKTIONFigur 1
- Page 29 and 30:
1SKOGLIG STATISTIKPRODUKTIONFigur 1
- Page 31 and 32:
1SKOGLIG STATISTIKPRODUKTIONFigur 1
- Page 33 and 34:
1SKOGLIG STATISTIKPRODUKTIONFigur 1
- Page 35 and 36:
1SKOGLIG STATISTIKPRODUKTIONTabell
- Page 37 and 38:
2FASTIGHETS- OCH ÄGARSTRUKTUR2 Fas
- Page 39 and 40:
2FASTIGHETS- OCH ÄGARSTRUKTURskogs
- Page 41 and 42:
2FASTIGHETS- OCH ÄGARSTRUKTURFigur
- Page 43 and 44:
2FASTIGHETS- OCH ÄGARSTRUKTURTabel
- Page 45 and 46:
2FASTIGHETS- OCH ÄGARSTRUKTURTabel
- Page 47 and 48:
2FASTIGHETS- OCH ÄGARSTRUKTURTabel
- Page 49 and 50:
2FASTIGHETS- OCH ÄGARSTRUKTURTabel
- Page 51 and 52:
3SKOG OCH SKOGSMARKBegrepp och defi
- Page 53 and 54:
3SKOG OCH SKOGSMARKFör avverknings
- Page 55 and 56:
3SKOG OCH SKOGSMARKFigur 3.3Virkesf
- Page 57 and 58:
3SKOG OCH SKOGSMARKTabell 3.1Landar
- Page 59 and 60:
3SKOG OCH SKOGSMARKTabell 3.3 Skogs
- Page 61 and 62:
3SKOG OCH SKOGSMARKTabell 3.4a (for
- Page 63 and 64:
3SKOG OCH SKOGSMARKTabell 3.5Virkes
- Page 65 and 66:
3SKOG OCH SKOGSMARKTabell 3.5 (fort
- Page 67 and 68:
3SKOG OCH SKOGSMARKTabell 3.5 (fort
- Page 69 and 70:
3SKOG OCH SKOGSMARKTabell 3.7 Virke
- Page 71 and 72:
3SKOG OCH SKOGSMARKTabell 3.7 (fort
- Page 73 and 74:
3SKOG OCH SKOGSMARKTabell 3.9Skogsm
- Page 75 and 76:
4SKADOR PÅ SKOGENskador orsakade a
- Page 77 and 78:
4SKADOR PÅ SKOGENTabell 4.1Tallens
- Page 79 and 80:
4SKADOR PÅ SKOGENTabell 4.4 Granen
- Page 81 and 82:
5NATUR OCH MILJÖ5 Natur och miljö
- Page 83 and 84:
5NATUR OCH MILJÖhuvudmomentet i in
- Page 85 and 86:
5NATUR OCH MILJÖodikad skogsmark
- Page 87 and 88:
5NATUR OCH MILJÖFigur 5.1Utvecklin
- Page 89 and 90:
5NATUR OCH MILJÖFigur 5.5Utsläpp
- Page 91 and 92:
5NATUR OCH MILJÖFigur 5.8Nyckelbio
- Page 93 and 94:
5NATUR OCH MILJÖTabell 5.1b Naturv
- Page 95 and 96:
5NATUR OCH MILJÖTab 5.2bLänochlan
- Page 97 and 98:
5NATUR OCH MILJÖTabell 5.4 Naturv
- Page 99 and 100:
5NATUR OCH MILJÖTabell 5.7 Rödlis
- Page 101 and 102:
5NATUR OCH MILJÖTabell 5.9 Virkesf
- Page 103 and 104:
5NATUR OCH MILJÖTabell 5.13106Area
- Page 105 and 106:
5NATUR OCH MILJÖTabell 5.15 Nyckel
- Page 107 and 108:
5NATUR OCH MILJÖTabell 5.17 Antal
- Page 109 and 110:
5NATUR OCH MILJÖTabell 5.19 Sparad
- Page 111 and 112:
5NATUR OCH MILJÖTabell 5.22Nivåer
- Page 113 and 114:
6SKOGSVÅRD6 SkogsvårdMagnus Fridh
- Page 115 and 116:
6SKOGSVÅRDFigur 6.1Årlig röjning
- Page 117 and 118:
6SKOGSVÅRDFigur 6.4Angiven naturli
- Page 119 and 120:
6SKOGSVÅRDTabell 6.2Länochlandsde
- Page 121 and 122:
6SKOGSVÅRDTabell 6.5Länochlandsde
- Page 123 and 124:
6SKOGSVÅRDTabell 6.7Använd föryn
- Page 125 and 126:
6SKOGSVÅRDTabell 6.10Försålda kv
- Page 127 and 128:
6SKOGSVÅRDTabell 6.12 Skyddsdiknin
- Page 129 and 130:
7AVVERKNING OCH VIRKESMÄTNING• E
- Page 131 and 132:
7AVVERKNING OCH VIRKESMÄTNINGFigur
- Page 133 and 134:
7AVVERKNING OCH VIRKESMÄTNINGFigur
- Page 135 and 136:
7AVVERKNING OCH VIRKESMÄTNINGTabel
- Page 137 and 138:
7AVVERKNING OCH VIRKESMÄTNINGTabel
- Page 139 and 140:
7AVVERKNING OCH VIRKESMÄTNINGTabel
- Page 141 and 142:
7AVVERKNING OCH VIRKESMÄTNINGTabel
- Page 143 and 144:
7AVVERKNING OCH VIRKESMÄTNINGTabel
- Page 145 and 146:
7AVVERKNING OCH VIRKESMÄTNINGTabel
- Page 147 and 148:
8VIRKESTRANSPORTER8 Virkestransport
- Page 149 and 150:
8VIRKESTRANSPORTERFigur 8.1Inrikes
- Page 151 and 152:
8VIRKESTRANSPORTERTabell 8.1a Rundv
- Page 153 and 154:
8VIRKESTRANSPORTERTabell 8.4Medeltr
- Page 155 and 156:
8VIRKESTRANSPORTERTabell 8.8Transpo
- Page 157 and 158:
9LAGER OCH FÖRBRUKNINGInventeringa
- Page 159 and 160:
9LAGER OCH FÖRBRUKNINGTabell 9.3 L
- Page 161 and 162:
9LAGER OCH FÖRBRUKNINGTabell 9.5Sk
- Page 163 and 164:
9LAGER OCH FÖRBRUKNINGTabell 9.8F
- Page 165 and 166:
9LAGER OCH FÖRBRUKNINGTabell 9.11a
- Page 167 and 168:
10 SKOGSINDUSTRINS PRODUKTIONI nati
- Page 169 and 170:
10 SKOGSINDUSTRINS PRODUKTIONFigur
- Page 171 and 172:
10 SKOGSINDUSTRINS PRODUKTIONFigur
- Page 173 and 174:
10 SKOGSINDUSTRINS PRODUKTIONTabell
- Page 175 and 176:
10 SKOGSINDUSTRINS PRODUKTIONTabell
- Page 177 and 178:
10 SKOGSINDUSTRINS PRODUKTIONTabell
- Page 179 and 180:
10 SKOGSINDUSTRINS PRODUKTIONTabell
- Page 181 and 182:
10 SKOGSINDUSTRINS PRODUKTIONTabell
- Page 183 and 184:
10 SKOGSINDUSTRINS PRODUKTIONTabell
- Page 185 and 186:
11 TRÄDBRÄNSLE11 TrädbränsleKat
- Page 187 and 188:
11 TRÄDBRÄNSLEFigur 11.2Sveriges
- Page 189 and 190:
11 TRÄDBRÄNSLETabell 11.1Produkti
- Page 191 and 192:
11 TRÄDBRÄNSLETabell 11.4 Vedför
- Page 193:
12 ARBETSKRAFTket samt skogsentrepr
- Page 196 and 197:
12 ARBETSKRAFTTabell 12.1 Antal ute
- Page 198:
12 ARBETSKRAFTTabell 12.3Sysselsatt
- Page 205 and 206:
12 ARBETSKRAFTTabell 12.12 Andel f
- Page 207 and 208:
12 ARBETSKRAFTTabell 12.14 Företag
- Page 209 and 210:
12 ARBETSKRAFTTabell 12.16 Genomsni
- Page 211 and 212:
12 ARBETSKRAFTTabell 12.19 Anmälda
- Page 213 and 214:
13 PRISER.13 PriserStefan KarlssonG
- Page 215 and 216:
13 PRISERav följande orsaker:10 %
- Page 217 and 218:
13 PRISERTabell 13.1Genomsnittspris
- Page 219 and 220:
13 PRISERTabell 13.3Genomsnittspris
- Page 221 and 222:
13 PRISERTabell 13.5Priser 1 m.m. p
- Page 223 and 224:
13 PRISERTabell 13.7Exportpriser p
- Page 225 and 226:
13 PRISERTabell 13.9Priser 1 för f
- Page 227 and 228:
14 EKONOMI14 EkonomiStefan Karlsson
- Page 229 and 230:
14 EKONOMI2000 års verksamhet enli
- Page 231 and 232:
14 EKONOMIFigur 14.1De svenska avve
- Page 233 and 234:
14 EKONOMITabell 14.2 Investeringar
- Page 235 and 236:
14 EKONOMITabell 14.4Skogsnäringen
- Page 237 and 238:
14 EKONOMITabell 14.6Investeringar
- Page 239 and 240:
14 EKONOMITabell 14.8Rambelopp för
- Page 241 and 242:
14 EKONOMITabell 14.10 Försöksåt
- Page 243 and 244:
14 EKONOMITabell 14.13 Beviljade st
- Page 245 and 246: 15 UTRIKESHANDEL15 UtrikeshandelSur
- Page 247 and 248: 15 UTRIKESHANDELfördelning på bet
- Page 249 and 250: 15 UTRIKESHANDELFigur 15.3Sveriges
- Page 251 and 252: 15 UTRIKESHANDELTabell 15.1Export a
- Page 253 and 254: 15 UTRIKESHANDELTabell 15.3Export a
- Page 255 and 256: 15 UTRIKESHANDELTabell 15.3 (forts.
- Page 257 and 258: 15 UTRIKESHANDELTabell 15.4 (forts.
- Page 259 and 260: 15 UTRIKESHANDELTabell 15.7Utrikesh
- Page 261 and 262: 15 UTRIKESHANDELTabell 15.10 Export
- Page 263 and 264: 15 UTRIKESHANDELTabell 15.13 Import
- Page 265 and 266: 16 INTERNATIONELLTbestår av två d
- Page 267 and 268: 16 INTERNATIONELLTFigur 16.1Sverige
- Page 269 and 270: 16 INTERNATIONELLTFigur 16.3Skogsma
- Page 271 and 272: 16 INTERNATIONELLTFigur 16.5Produkt
- Page 273 and 274: 16 INTERNATIONELLTTabell 16.2Skogli
- Page 275 and 276: 16 INTERNATIONELLTTabell 16.4Skogli
- Page 277 and 278: 16 INTERNATIONELLTTabell 16.5 Virke
- Page 279 and 280: 16 INTERNATIONELLTTabell 16.7Region
- Page 281 and 282: 16 INTERNATIONELLTTabell 16.9 Expor
- Page 283 and 284: 16 INTERNATIONELLTTabell 16.10 Vär
- Page 285 and 286: BILAGOREffektivt värmevärdeBräns
- Page 287 and 288: BILAGORi grupper. Björken är norm
- Page 289 and 290: BILAGORBilaga 4 /Appendix 4/Definit
- Page 291 and 292: BILAGORwww.scb.se, scb@scb.seStora
- Page 293 and 294: SUMMARYSummary1 The production of f
- Page 295: SUMMARYThe data is generally presen
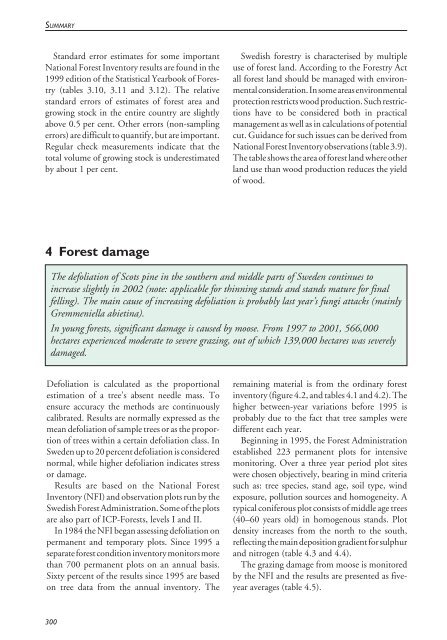
- Page 299 and 300: SUMMARYstrong influence on soil and
- Page 301 and 302: SUMMARYThis chapter covers felling
- Page 303 and 304: SUMMARYStatistics are available fro
- Page 305 and 306: SUMMARY12 Education and labour forc
- Page 307 and 308: SUMMARYThis chapter presents domest
- Page 309 and 310: SUMMARYThe forest industry sector i
- Page 311 and 312: SUMMARYThis chapter gives informati
- Page 313 and 314: SUMMARYProducts. Data is also avail
- Page 315 and 316: VOCABULARYAvtalshöjningAvverkadAvv
- Page 317 and 318: VOCABULARYFanerskivor Veneer sheets
- Page 319 and 320: VOCABULARYIndustriprocesserIndustri
- Page 321 and 322: VOCABULARYLövträHardwoodMm 3 f pb
- Page 323 and 324: VOCABULARY(= stämplingspost) cutti
- Page 325 and 326: VOCABULARYSkogsvetareSkogsvårdSkog
- Page 327 and 328: VOCABULARYTimmeTimmerTimmerförbruk
- Page 329 and 330: VOCABULARYYrkesverksamhetZZonZonbre
- Page 331: TECKEN OCH FÖRKORTNINGARSOU Staten