cahier scientifique revue technique luxembourgeoise
cahier scientifique revue technique luxembourgeoise
cahier scientifique revue technique luxembourgeoise

Erfolgreiche ePaper selbst erstellen
Machen Sie aus Ihren PDF Publikationen ein blätterbares Flipbook mit unserer einzigartigen Google optimierten e-Paper Software.
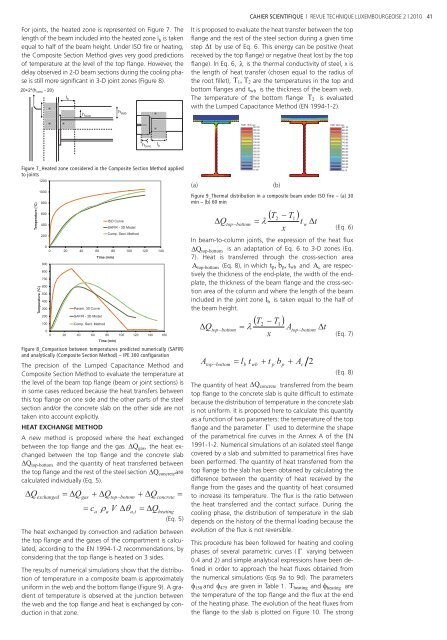
For joints, the heated zone is represented on Figure 7. The<br />
length of the beam included into the heated zone l b is taken<br />
equal to half of the beam height. Under ISO fi re or heating,<br />
the Composite Section Method gives very good predictions<br />
of temperature at the level of the top fl ange. However, the<br />
delay observed in 2-D beam sections during the cooling phase<br />
is still more signifi cant in 3-D joint zones (Figure 8).<br />
20+2*(h conc - 20)<br />
l b<br />
h conc<br />
h conc<br />
Figure 7_Heated zone considered in the Composite Section Method applied<br />
to joints<br />
Temperature (°C)<br />
Temperature (°C)<br />
1200<br />
1000<br />
800<br />
600<br />
400<br />
200<br />
Figure 8_Comparison between temperatures predicted numerically (SAFIR)<br />
and analytically (Composite Section Method) – IPE 300 configuration<br />
The precision of the Lumped Capacitance Method and<br />
Composite Section Method to evaluate the temperature at<br />
the level of the beam top fl ange (beam or joint sections) is<br />
in some cases reduced because the heat transfers between<br />
this top fl ange on one side and the other parts of the steel<br />
section and/or the concrete slab on the other side are not<br />
taken into account explicitly.<br />
HEAT EXCHANGE METHOD<br />
A new method is proposed where the heat exchanged<br />
between the top fl ange and the gas �Qgas, the heat exchanged<br />
between the top fl ange and the concrete slab<br />
�Qtop-bottom and the quantity of heat transferred between<br />
the top fl ange and the rest of the steel section �Qconcrete are<br />
calculated individually (Eq. 5).<br />
heating<br />
(Eq. 5)<br />
The heat exchanged by convection and radiation between<br />
the top fl ange and the gases of the compartment is calculated,<br />
according to the EN 1994-1-2 recommendations, by<br />
considering that the top fl ange is heated on 3 sides.<br />
The results of numerical simulations show that the distribution<br />
of temperature in a composite beam is approximately<br />
uniform in the web and the bottom fl ange (Figure 9). A gradient<br />
of temperature is observed at the junction between<br />
the web and the top fl ange and heat is exchanged by conduction<br />
in that zone.<br />
h slab<br />
0<br />
0 20 40 60 80 100 120 140<br />
900<br />
800<br />
700<br />
600<br />
500<br />
400<br />
300<br />
200<br />
100<br />
Param. 30 Curve<br />
SAFIR - 3D Model<br />
Comp. Sect. Method<br />
Time (min)<br />
ISO Curve<br />
SAFIR - 3D Model<br />
Comp. Sect. Method<br />
0<br />
0 20 40 60 80 100 120 140 160<br />
Time (min)<br />
� exchanged � �Qgas<br />
� �Qtop�bottom<br />
Q � �Q<br />
�<br />
� a �a<br />
V ��a,<br />
t<br />
c � �Q<br />
l b<br />
concrete<br />
CAHIER SCIENTIFIQUE | REVUE TECHNIQUE LUXEMBOURGEOISE 2 | 2010 41<br />
It is proposed to evaluate the heat transfer between the top<br />
fl ange and the rest of the steel section during a given time<br />
step �t by use of Eq. 6. This energy can be positive (heat<br />
received by the top fl ange) or negative (heat lost by the top<br />
fl ange). In Eq. 6, � is the thermal conductivity of steel, x is<br />
the length of heat transfer (chosen equal to the radius of<br />
the root fi llet), T1, T2 are the temperatures in the top and<br />
bottom fl anges and twb is the thickness of the beam web.<br />
The temperature of the bottom fl ange T2 is evaluated<br />
with the Lumped Capacitance Method (EN 1994-1-2).<br />
(a)<br />
TIME: 1800 sec<br />
822.90<br />
800.00<br />
775.00<br />
750.00<br />
725.00<br />
700.00<br />
675.00<br />
650.00<br />
625.00<br />
600.00<br />
575.00<br />
550.00<br />
525.00<br />
500.00<br />
21.90<br />
(a) (b)<br />
Figure 9_Thermal distribution in a composite beam under ISO fire – (a) 30<br />
min – (b) 60 min<br />
(Eq. 6)<br />
In beam-to-column joints, the expression of the heat fl ux<br />
�Qtop-bottom is an adaptation of Eq. 6 to 3-D zones (Eq.<br />
7). Heat is transferred through the cross-section area<br />
Atop-bottom (Eq. 8), in which tp, bp, twb and Ac are respectively<br />
the thickness of the end-plate, the width of the endplate,<br />
the thickness of the beam fl ange and the cross-section<br />
area of the column and where the length of the beam<br />
included in the joint zone lb is taken equal to the half of<br />
the beam height.<br />
(Eq. 7)<br />
(Eq. 8)<br />
The quantity of heat �Qconcrete transferred from the beam<br />
top fl ange to the concrete slab is quite diffi cult to estimate<br />
because the distribution of temperature in the concrete slab<br />
is not uniform. It is proposed here to calculate this quantity<br />
as a function of two parameters: the temperature of the top<br />
fl ange and the parameter � used to determine the shape<br />
of the parametrical fi re curves in the Annex A of the EN<br />
1991-1-2. Numerical simulations of an isolated steel fl ange<br />
covered by a slab and submitted to parametrical fi res have<br />
been performed. The quantity of heat transferred from the<br />
top fl ange to the slab has been obtained by calculating the<br />
difference between the quantity of heat received by the<br />
fl ange from the gases and the quantity of heat consumed<br />
to increase its temperature. The fl ux is the ratio between<br />
the heat transferred and the contact surface. During the<br />
cooling phase, the distribution of temperature in the slab<br />
depends on the history of the thermal loading because the<br />
evolution of the fl ux is not reversible.<br />
This procedure has been followed for heating and cooling<br />
phases of several parametric curves ( � varying between<br />
0.4 and 2) and simple analytical expressions have been defi<br />
ned in order to approach the heat fl uxes obtained from<br />
the numerical simulations (Eqs 9a to 9d). The parameters<br />
�150 and �475 are given in Table 1. Theating and �heating are<br />
the temperature of the top fl ange and the fl ux at the end<br />
of the heating phase. The evolution of the heat fl uxes from<br />
the fl ange to the slab is plotted on Figure 10. The strong<br />
(b)<br />
�T�T� 2 1<br />
Qtop bottom � � t w �t<br />
x<br />
� �<br />
�T�T� 2 1<br />
� top�bottom<br />
� � Atop�<br />
x<br />
Q bottom<br />
A � l t � t b � A<br />
top�<br />
bottom<br />
b<br />
wb<br />
p<br />
p<br />
c<br />
2<br />
�t<br />
TIME: 3600 sec<br />
941.40<br />
860.00<br />
830.00<br />
800.00<br />
770.00<br />
740.00<br />
710.00<br />
680.00<br />
650.00<br />
620.00<br />
590.00<br />
560.00<br />
530.00<br />
500.00<br />
49.70