28-37 Online-Qualit−tskontrolle - Bauverlag
28-37 Online-Qualit−tskontrolle - Bauverlag
28-37 Online-Qualit−tskontrolle - Bauverlag

Sie wollen auch ein ePaper? Erhöhen Sie die Reichweite Ihrer Titel.
YUMPU macht aus Druck-PDFs automatisch weboptimierte ePaper, die Google liebt.
[ ( ) ]<br />
u R 2 4 �0 1 �0 4<br />
= 1– +<br />
∆p 8� 3 �w 3 �w<br />
∆l<br />
Für<br />
∆p<br />
� ∞ (Gl. 3)<br />
∆l<br />
gilt:<br />
�w � ∞ (Gl. 4)<br />
Das bedeutet, dass<br />
u R<br />
(Gl. 5)<br />
2<br />
�<br />
∆p 8�<br />
∆l<br />
Ist �0 = �w, so wird der Ausdruck<br />
innerhalb der eckigen<br />
Klammern zu null, d. h., in<br />
dem Punkt, in dem die Funktion<br />
die Abszisse schneidet,<br />
ist �0 = �w.<br />
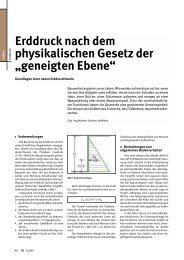
In Bild 9 ist zur Überprüfung<br />
der Ausgabedaten das<br />
Verfahren zur grafischen Ermittlung<br />
von Vikosität und<br />
Fließgrenze mithilfe der<br />
Messwerte aus dem <strong>Online</strong>-<br />
Viskosimeter dargestellt.<br />
Die Primärdaten wurden<br />
mittels nicht linearer Regression<br />
durch ein inverses<br />
Polynom vierter Ordnung<br />
approximiert und sind als<br />
Punkte eingetragen. Durch<br />
Extrapolation erhält man<br />
den Schnittpunkt mit der<br />
Abszisse.<br />
Qualitätskontrolle<br />
Quality Control<br />
9 Grafische Ermittlung der dynamischen Viskosität � und der Fließgrenze<br />
�0 aus den Primärmessdaten Druckverlust und Volumenstrom<br />
des <strong>Online</strong>-Viskosimeters und Überprüfung der Ausgabewerte<br />
des <strong>Online</strong>-Viskosimeters (gestrichelte Asymptoten)<br />
9 Graphic presentation of the dynamic viscosity � and the flow limit<br />
�0 from the primary measurement data – pressure loss and volumetric<br />
flow – of the <strong>Online</strong> Viscometer and checking of the output values<br />
of the <strong>Online</strong> Viscometer (broken asymptotes)<br />
Fig. 9 presents the method<br />
for determining viscosity and<br />
flow limit with the aid of measurement<br />
values from the <strong>Online</strong><br />
Viscometer to check the<br />
output data.<br />
The primary data were approximated<br />
by means of nonlinear<br />
regression through an<br />
inverse polynomial of the<br />
fourth degree and are entered<br />
in the form of dots. The intersection<br />
with the abscise is obtained<br />
through extrapolation.<br />
It is now possible to check<br />
the additional recorded output<br />
values from the <strong>Online</strong> Viscometer<br />
by graphic means.<br />
This example shows that<br />
the <strong>Online</strong> Viscometer in comparison<br />
with the applied basis<br />
of calculation provides slightly<br />
too low values for the flow limit<br />
and too high ones for the<br />
plastic viscosity.<br />
6 Results of the<br />
<strong>Online</strong> Measurement<br />
Method<br />
This evaluation method is<br />
based on a non-linear regression,<br />
as a result of which various<br />
uncertainties result in the<br />
case of small measurement<br />
values. Measurements were<br />
Tunnel 5/2003 35