

Annual Report and Accounts 2012 - Speedy Hire plc
Annual Report and Accounts 2012 - Speedy Hire plc
Annual Report and Accounts 2012 - Speedy Hire plc

Create successful ePaper yourself
Turn your PDF publications into a flip-book with our unique Google optimized e-Paper software.
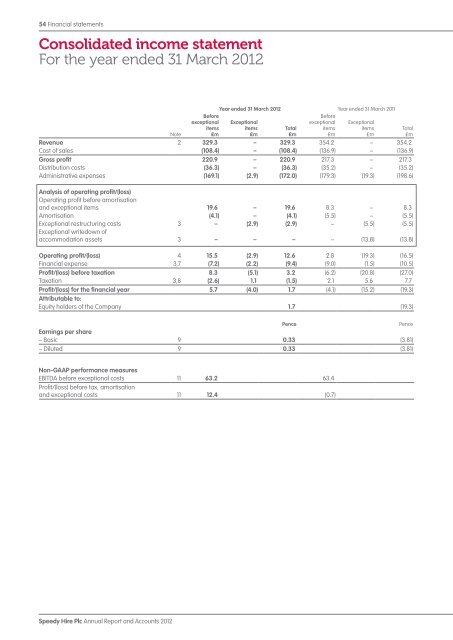
54 Financial statements<br />
Consolidated income statement<br />
For the year ended 31 March <strong>2012</strong><br />
<strong>Speedy</strong> <strong>Hire</strong> Plc <strong>Annual</strong> <strong>Report</strong> <strong>and</strong> <strong>Accounts</strong> <strong>2012</strong><br />
Note<br />
Before<br />
exceptional<br />
items<br />
£m<br />
Year ended 31 March <strong>2012</strong> Year ended 31 March 2011<br />
Exceptional<br />
items<br />
£m<br />
Total<br />
£m<br />
Before<br />
exceptional<br />
items<br />
£m<br />
Exceptional<br />
items<br />
£m<br />
Revenue 2 329.3 – 329.3 354.2 – 354.2<br />
Cost of sales (108.4) – (108.4) (136.9) – (136.9)<br />
Gross profit 220.9 – 220.9 217.3 – 217.3<br />
Distribution costs (36.3) – (36.3) (35.2) – (35.2)<br />
Administrative expenses (169.1) (2.9) (172.0) (179.3) (19.3) (198.6)<br />
Analysis of operating profit/(loss)<br />
Operating profit before amortisation<br />
<strong>and</strong> exceptional items 19.6 – 19.6 8.3 – 8.3<br />
Amortisation (4.1) – (4.1) (5.5) – (5.5)<br />
Exceptional restructuring costs 3 – (2.9) (2.9) – (5.5) (5.5)<br />
Exceptional writedown of<br />
accommodation assets 3 – – – – (13.8) (13.8)<br />
Operating profit/(loss) 4 15.5 (2.9) 12.6 2.8 (19.3) (16.5)<br />
Financial expense 3,7 (7.2) (2.2) (9.4) (9.0) (1.5) (10.5)<br />
Profit/(loss) before taxation 8.3 (5.1) 3.2 (6.2) (20.8) (27.0)<br />
Taxation 3,8 (2.6) 1.1 (1.5) 2.1 5.6 7.7<br />
Profit/(loss) for the financial year 5.7 (4.0) 1.7 (4.1) (15.2) (19.3)<br />
Attributable to:<br />
Equity holders of the Company 1.7 (19.3)<br />
Pence Pence<br />
Earnings per share<br />
– Basic 9 0.33 (3.81)<br />
– Diluted 9 0.33 (3.81)<br />
Non-GAAP performance measures<br />
EBITDA before exceptional costs 11 63.2 63.4<br />
Profit/(loss) before tax, amortisation<br />
<strong>and</strong> exceptional costs 11 12.4 (0.7)<br />
Total<br />
£m