

Annual Report and Accounts 2012 - Speedy Hire plc
Annual Report and Accounts 2012 - Speedy Hire plc
Annual Report and Accounts 2012 - Speedy Hire plc

Create successful ePaper yourself
Turn your PDF publications into a flip-book with our unique Google optimized e-Paper software.
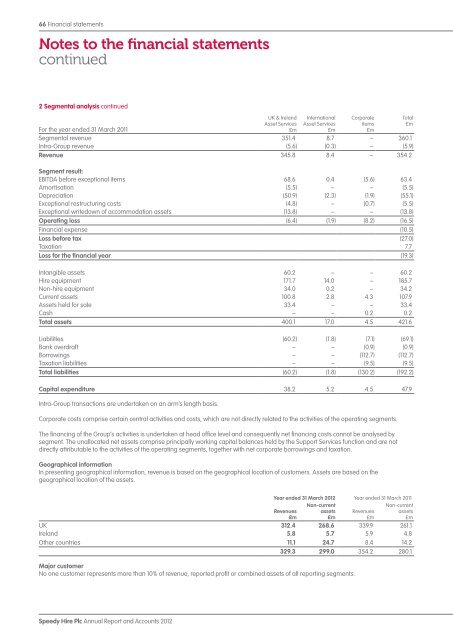
66 Financial statements<br />
Notes to the financial statements<br />
continued<br />
2 Segmental analysis continued<br />
For the year ended 31 March 2011<br />
<strong>Speedy</strong> <strong>Hire</strong> Plc <strong>Annual</strong> <strong>Report</strong> <strong>and</strong> <strong>Accounts</strong> <strong>2012</strong><br />
UK & Irel<strong>and</strong><br />
Asset Services<br />
£m<br />
International<br />
Asset Services<br />
£m<br />
Corporate<br />
items<br />
£m<br />
Segmental revenue 351.4 8.7 – 360.1<br />
Intra-Group revenue (5.6) (0.3) – (5.9)<br />
Revenue 345.8 8.4 – 354.2<br />
Segment result:<br />
EBITDA before exceptional items 68.6 0.4 (5.6) 63.4<br />
Amortisation (5.5) – – (5.5)<br />
Depreciation (50.9) (2.3) (1.9) (55.1)<br />
Exceptional restructuring costs (4.8) – (0.7) (5.5)<br />
Exceptional writedown of accommodation assets (13.8) – – (13.8)<br />
Operating loss (6.4) (1.9) (8.2) (16.5)<br />
Financial expense (10.5)<br />
Loss before tax (27.0)<br />
Taxation 7.7<br />
Loss for the financial year (19.3)<br />
Intangible assets 60.2 – – 60.2<br />
<strong>Hire</strong> equipment 171.7 14.0 – 185.7<br />
Non-hire equipment 34.0 0.2 – 34.2<br />
Current assets 100.8 2.8 4.3 107.9<br />
Assets held for sale 33.4 – – 33.4<br />
Cash – – 0.2 0.2<br />
Total assets 400.1 17.0 4.5 421.6<br />
Liabilities (60.2) (1.8) (7.1) (69.1)<br />
Bank overdraft – – (0.9) (0.9)<br />
Borrowings – – (112.7) (112.7)<br />
Taxation liabilities – – (9.5) (9.5)<br />
Total liabilities (60.2) (1.8) (130.2) (192.2)<br />
Capital expenditure 38.2 5.2 4.5 47.9<br />
Intra-Group transactions are undertaken on an arm’s length basis.<br />
Corporate costs comprise certain central activities <strong>and</strong> costs, which are not directly related to the activities of the operating segments.<br />
The financing of the Group’s activities is undertaken at head office level <strong>and</strong> consequently net financing costs cannot be analysed by<br />
segment. The unallocated net assets comprise principally working capital balances held by the Support Services function <strong>and</strong> are not<br />
directly attributable to the activities of the operating segments, together with net corporate borrowings <strong>and</strong> taxation.<br />
Geographical information<br />
In presenting geographical information, revenue is based on the geographical location of customers. Assets are based on the<br />
geographical location of the assets.<br />
Total<br />
£m<br />
Year ended 31 March <strong>2012</strong> Year ended 31 March 2011<br />
Revenues<br />
£m<br />
Non-current<br />
assets<br />
£m<br />
Revenues<br />
£m<br />
Non-current<br />
assets<br />
£m<br />
UK 312.4 268.6 339.9 261.1<br />
Irel<strong>and</strong> 5.8 5.7 5.9 4.8<br />
Other countries 11.1 24.7 8.4 14.2<br />
329.3 299.0 354.2 280.1<br />
Major customer<br />
No one customer represents more than 10% of revenue, reported profit or combined assets of all reporting segments.