PhD thesis - School of Informatics - University of Edinburgh
PhD thesis - School of Informatics - University of Edinburgh
PhD thesis - School of Informatics - University of Edinburgh

Create successful ePaper yourself
Turn your PDF publications into a flip-book with our unique Google optimized e-Paper software.
Chapter 3. Tracking English Inclusions in German 97<br />
F-score<br />
100<br />
90<br />
80<br />
70<br />
60<br />
50<br />
40<br />
30<br />
Statistical tagger<br />
English inclusion classifier<br />
10000 20000 30000 40000 50000 60000 70000 80000<br />
Amount <strong>of</strong> training data (in tokens)<br />
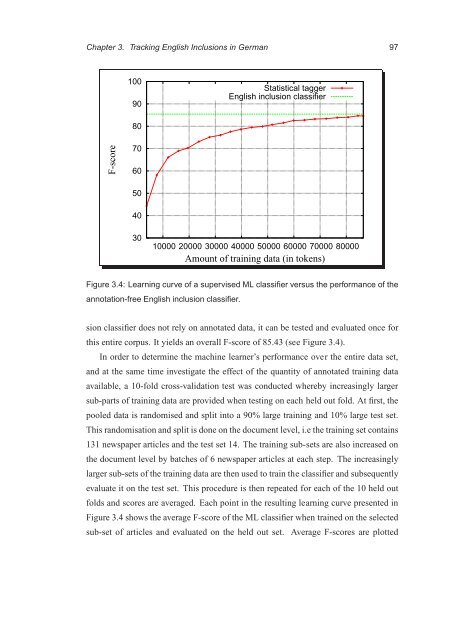
Figure 3.4: Learning curve <strong>of</strong> a supervised ML classifier versus the performance <strong>of</strong> the<br />
annotation-free English inclusion classifier.<br />
sion classifier does not rely on annotated data, it can be tested and evaluated once for<br />
this entire corpus. It yields an overall F-score <strong>of</strong> 85.43 (see Figure 3.4).<br />
In order to determine the machine learner’s performance over the entire data set,<br />
and at the same time investigate the effect <strong>of</strong> the quantity <strong>of</strong> annotated training data<br />
available, a 10-fold cross-validation test was conducted whereby increasingly larger<br />
sub-parts <strong>of</strong> training data are provided when testing on each held out fold. At first, the<br />
pooled data is randomised and split into a 90% large training and 10% large test set.<br />
This randomisation and split is done on the document level, i.e the training set contains<br />
131 newspaper articles and the test set 14. The training sub-sets are also increased on<br />
the document level by batches <strong>of</strong> 6 newspaper articles at each step. The increasingly<br />
larger sub-sets <strong>of</strong> the training data are then used to train the classifier and subsequently<br />
evaluate it on the test set. This procedure is then repeated for each <strong>of</strong> the 10 held out<br />
folds and scores are averaged. Each point in the resulting learning curve presented in<br />
Figure 3.4 shows the average F-score <strong>of</strong> the ML classifier when trained on the selected<br />
sub-set <strong>of</strong> articles and evaluated on the held out set. Average F-scores are plotted