- Page 1 and 2:
ESCAP/WMO Typhoon Committee KUJIRAI
- Page 3 and 4:
CONTENTS ESCAP, WMO and the ESCAP/W
- Page 5 and 6:
Chapter 4 WMO TC NEWS TCAR ESCAP, W
- Page 7 and 8:
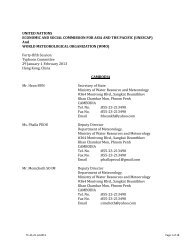
ECONOMIC AND SOCIAL COMMISSION FOR
- Page 9 and 10:
TYPHOON COMMITTEE (2009) Chairman M
- Page 11 and 12:
FOREWORD The ESCAP/WMO Typhoon Comm
- Page 13 and 14:
Introduction The Typhoon Committee
- Page 15 and 16:
I.I. Summary of progress in Key Res
- Page 17 and 18:
Table of Comparison data reported f
- Page 19 and 20:
- Heavy rain with speed winds 10-15
- Page 21 and 22:
Co-operate with local community org
- Page 23 and 24:
2. Progress on Key Result Area 2: M
- Page 25 and 26:
on web. The module outcomes are sti
- Page 27 and 28:
Strategic Plan and progress on the
- Page 29 and 30:
Fig. 13: 850hPa Wind and Radar Echo
- Page 31 and 32:
points are related tightly to the d
- Page 33 and 34:
eyewall and that the next maximum r
- Page 35 and 36:
the degree of similarity. According
- Page 37 and 38:
Advanced training seminar on theory
- Page 39 and 40:
HONG KONG, CHINA 1. Progress on Key
- Page 41 and 42:
(b) Figure 12Hong Kong Observatory
- Page 43 and 44:
and analyzed later.When the situati
- Page 45 and 46:
in Localized Systems) nowcasting sy
- Page 47 and 48:
JAPAN 1. Progress on Key Result Are
- Page 49 and 50:
Figure 9 Technical assistance team
- Page 51 and 52:
Figure 13 Removal process of a land
- Page 53 and 54:
TCAR CHAPTER 1 - TYPHOON COMMITTEE
- Page 55 and 56:
Reporting on intermediate results i
- Page 57 and 58:
JMA for issuing weather warnings an
- Page 59 and 60:
approximately 60 km horizontally an
- Page 61 and 62:
-2. Promotion of Countermeasures fo
- Page 63 and 64:
1. Monitoring and forecasting of wa
- Page 65 and 66: Figure 33 Storm surge observation a
- Page 67 and 68: Singapore d-1. Ninth Typhoon Commit
- Page 69 and 70: MACAO, CHINA 1. Progress on Key Res
- Page 71 and 72: The power company continued to impr
- Page 73 and 74: community associations visited the
- Page 75 and 76: f. Identified Opportunities/Challen
- Page 77 and 78: Develop expertise in writing simple
- Page 79 and 80: 2.3 Improved Typhoon-related Disast
- Page 81 and 82: the theme of the World Health Day o
- Page 83 and 84: strategic locations to enable emerg
- Page 85 and 86: visits to the project sites were un
- Page 87 and 88: Please refer to Key Result Area 1(c
- Page 89 and 90: particularly in the Magat River Bas
- Page 91 and 92: . Hydrological Achievements/Results
- Page 93 and 94: Climate Analysis Using Reanalysis D
- Page 95 and 96: s Fig. 9. Flood damage in urban are
- Page 97 and 98: Fig. 13. Establishment of user-tail
- Page 99 and 100: Fig. 17. Map of the Four Rivers Pro
- Page 101 and 102: Development of System for Disaster
- Page 103 and 104: 2. Progress on Key Result Area 2: M
- Page 105 and 106: will be used to establish more effi
- Page 107 and 108: (5 years), the Philippines, and Hon
- Page 109 and 110: Fig. 31. Expert Mission in Da Nang
- Page 111 and 112: Advanced Objective Dvorak Technique
- Page 113 and 114: TCAR CHAPTER 1 - TYPHOON COMMITTEE
- Page 115: Fig. 39. Impact of IASI data in tro
- Page 119 and 120: One of the most important training
- Page 121 and 122: Participants from Korea gave the fo
- Page 123 and 124: SINGAPORE II. Summary of progress i
- Page 125 and 126: d. Research, Training, and Other Ac
- Page 127 and 128: THAILAND 1 Progress on Key Result A
- Page 129 and 130: 1) Identify Members’ key agencies
- Page 131 and 132: forecast on 64 bits LINUX parallel
- Page 133 and 134: organization to operate the disaste
- Page 135 and 136: Centre to design “Mr. Disaster Wa
- Page 137 and 138: USA II. Summary of Progress in Key
- Page 139 and 140: of Honolulu Hawaii and Cabinet. The
- Page 141 and 142: · In-house seminars. WFO Guam held
- Page 143 and 144: · Mr. Roger Edson 3232 Hueneme Roa
- Page 145 and 146: e. Regional Cooperation Achievement
- Page 147 and 148: f. Identified Opportunities/Challen
- Page 149 and 150: Tool bar · Developing the distribu
- Page 151 and 152: Tel: (84-4) 3 8 256 278, Fax: (+84-
- Page 153 and 154: 1.2 TYPHOON COMMITTEE SECRETARIAT (
- Page 155 and 156: Seventh International Workshop on T
- Page 157 and 158: 2.1 REPORT ON INDIVIDUAL TROPICAL C
- Page 159 and 160: on that day. Koppu intensified into
- Page 161 and 162: TCAR CHAPTER 2 - TROPICAL CYCLONES
- Page 163 and 164: TCAR CHAPTER 2 - TROPICAL CYCLONES
- Page 165 and 166: 2.2.2 CHAN-HOM (0902) 2 - 13 June T
- Page 167 and 168:
2.2.4 NANGKA (0904) 22 - 27 June TC
- Page 169 and 170:
2.2.6 MOLAVE (0906) 15 July - 19 Ju
- Page 171 and 172:
2.2.8 MORAKOT (0908) 24 July - 01 A
- Page 173 and 174:
2.2.10 VAMCO (0910) 16 August - 26
- Page 175 and 176:
2.2.12 DUJUAN (0912) 2 September -
- Page 177 and 178:
2.2.14 CHOI-WAN (0914) 12 - 21 Sept
- Page 179 and 180:
2.2.16 KETSANA (0916) 25 September-
- Page 181 and 182:
2.2.18 MELOR (0918) 29 September -
- Page 183 and 184:
2.2.20 LUPIT (0920) 14 - 31 October
- Page 185 and 186:
2.2.22 NIDA (0922) 21 November - 3
- Page 187 and 188:
TCAR CHAPTER 3 - CONTRIBUTED PAPERS
- Page 189 and 190:
TCAR CHAPTER 3 - CONTRIBUTED PAPERS
- Page 191 and 192:
TCAR CHAPTER 3 - CONTRIBUTED PAPERS
- Page 193 and 194:
TCAR CHAPTER 3 - CONTRIBUTED PAPERS
- Page 195 and 196:
TCAR CHAPTER 3 - CONTRIBUTED PAPERS
- Page 197 and 198:
TCAR CHAPTER 3 - CONTRIBUTED PAPERS
- Page 199 and 200:
TCAR CHAPTER 3 - CONTRIBUTED PAPERS
- Page 201 and 202:
TCAR CHAPTER 3 - CONTRIBUTED PAPERS
- Page 203 and 204:
TCAR CHAPTER 3 - CONTRIBUTED PAPERS
- Page 205 and 206:
TCAR CHAPTER 3 - CONTRIBUTED PAPERS
- Page 207 and 208:
TCAR CHAPTER 3 - CONTRIBUTED PAPERS
- Page 209 and 210:
TCAR CHAPTER 3 - CONTRIBUTED PAPERS
- Page 211 and 212:
TCAR CHAPTER 3 - CONTRIBUTED PAPERS
- Page 213 and 214:
TCAR CHAPTER 3 - CONTRIBUTED PAPERS
- Page 215 and 216:
TCAR CHAPTER 3 - CONTRIBUTED PAPERS
- Page 217 and 218:
TCAR CHAPTER 3 - CONTRIBUTED PAPERS
- Page 219 and 220:
TCAR CHAPTER 3 - CONTRIBUTED PAPERS
- Page 221 and 222:
TCAR CHAPTER 3 - CONTRIBUTED PAPERS
- Page 223 and 224:
TCAR CHAPTER 3 - CONTRIBUTED PAPERS
- Page 225 and 226:
TCAR CHAPTER 3 - CONTRIBUTED PAPERS
- Page 227 and 228:
TCAR CHAPTER 3 - CONTRIBUTED PAPERS
- Page 229 and 230:
TCAR CHAPTER 3 - CONTRIBUTED PAPERS
- Page 231 and 232:
TCAR CHAPTER 3 - CONTRIBUTED PAPERS
- Page 233 and 234:
TCAR CHAPTER 3 - CONTRIBUTED PAPERS
- Page 235 and 236:
TCAR CHAPTER 3 - CONTRIBUTED PAPERS
- Page 237 and 238:
TCAR CHAPTER 3 - CONTRIBUTED PAPERS
- Page 239 and 240:
TCAR CHAPTER 3 - CONTRIBUTED PAPERS
- Page 241 and 242:
TCAR CHAPTER 3 - CONTRIBUTED PAPERS
- Page 243 and 244:
TCAR CHAPTER 3 - CONTRIBUTED PAPERS
- Page 245 and 246:
TCAR CHAPTER 3 - CONTRIBUTED PAPERS
- Page 247 and 248:
TCAR CHAPTER 3 - CONTRIBUTED PAPERS
- Page 249 and 250:
TCAR CHAPTER 3 - CONTRIBUTED PAPERS
- Page 251 and 252:
TCAR CHAPTER 3 - CONTRIBUTED PAPERS
- Page 253 and 254:
TCAR CHAPTER 3 - CONTRIBUTED PAPERS
- Page 255 and 256:
TCAR CHAPTER 3 - CONTRIBUTED PAPERS
- Page 257 and 258:
TCAR CHAPTER 3 - CONTRIBUTED PAPERS
- Page 259 and 260:
TCAR CHAPTER 3 - CONTRIBUTED PAPERS
- Page 261 and 262:
4.1 Introduction TCAR CHAPTER 4 - W
- Page 263 and 264:
- Attachment of Typhoon Forecasters
- Page 265 and 266:
It was attended by more than 50 int
- Page 267 and 268:
- RA IV Hurricane Committee, Thirty
- Page 269 and 270:
Abstract TCAR CHAPTER 5 - RESEARCH
- Page 271 and 272:
TCAR CHAPTER 5 - RESEARCH FELLOWSHI
- Page 273 and 274:
TCAR CHAPTER 5 - RESEARCH FELLOWSHI
- Page 275 and 276:
TCAR CHAPTER 5 - RESEARCH FELLOWSHI
- Page 277 and 278:
TCAR CHAPTER 5 - RESEARCH FELLOWSHI
- Page 279 and 280:
TCAR CHAPTER 5 - RESEARCH FELLOWSHI
- Page 281 and 282:
TCAR CHAPTER 5 - RESEARCH FELLOWSHI
- Page 283 and 284:
First TCAR CHAPTER 5 - RESEARCH FEL
- Page 285 and 286:
TCAR CHAPTER 5 - RESEARCH FELLOWSHI
- Page 287 and 288:
TCAR CHAPTER 5 - RESEARCH FELLOWSHI
- Page 289 and 290:
TCAR CHAPTER 5 - RESEARCH FELLOWSHI
- Page 291 and 292:
TCAR CHAPTER 5 - RESEARCH FELLOWSHI
- Page 293 and 294:
TCAR CHAPTER 5 - RESEARCH FELLOWSHI
- Page 295 and 296:
TCAR CHAPTER 5 - RESEARCH FELLOWSHI
- Page 297 and 298:
TCAR CHAPTER 5 - RESEARCH FELLOWSHI
- Page 299 and 300:
TCAR CHAPTER 5 - RESEARCH FELLOWSHI
- Page 301:
TCAR CHAPTER 5 - RESEARCH FELLOWSHI