TCAR - Typhoon Committee
TCAR - Typhoon Committee
TCAR - Typhoon Committee

You also want an ePaper? Increase the reach of your titles
YUMPU automatically turns print PDFs into web optimized ePapers that Google loves.
274<br />
ESCAP/WMO<br />
<strong>Typhoon</strong> <strong>Committee</strong> Annual Review 2009<br />
outlier bins placed at both ends.It was constructed by<br />
counting the number of verifying observations falling<br />
within each bin.The relative frequency in each bin was<br />
then used as the weight to calibrate the probability<br />
forecasts.<br />
Unlike temperature or precipitation forecasts in which<br />
each EPS member would always output a forecast,<br />
some members would not provide any forecast if the<br />
TC was forecast to dissipate.Besides, the verifying BT<br />
dataset from HKO did not contain any information for<br />
LOW (i.e. systems with maximum wind less than 22 kt).<br />
For cases when both forecast and observation were<br />
not available (i.e. EPS members correctly forecast<br />
the dissipation of the TC), the following procedures<br />
were adopted to assign the frequency: if there were<br />
m members in total not outputting a forecast, i.e. each<br />
of the first m bins represent a correct forecast, the<br />
frequency count will be equally assigned to these m<br />
bins.In other words, 1/m will be assigned to each of<br />
the m bins.<br />
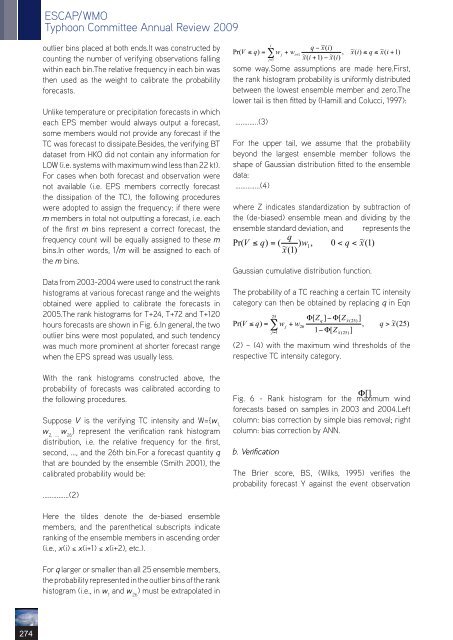
Data from 2003-2004 were used to construct the rank<br />
histograms at various forecast range and the weights<br />
obtained were applied to calibrate the forecasts in<br />
2005.The rank histograms for T+24, T+72 and T+120<br />
hours forecasts are shown in Fig. 6.In general, the two<br />
outlier bins were most populated, and such tendency<br />
was much more prominent at shorter forecast range<br />
when the EPS spread was usually less.<br />
With the rank histograms constructed above, the<br />
probability of forecasts was calibrated according to<br />
the following procedures.<br />
Suppose V is the verifying TC intensity and W={w 1,<br />
w 2, …, w 26 } represent the verification rank histogram<br />
distribution, i.e. the relative frequency for the first,<br />
second, …, and the 26th bin.For a forecast quantity q<br />
that are bounded by the ensemble (Smith 2001), the<br />
calibrated probability would be:<br />
……………(2)<br />
Here the tildes denote the de-biased ensemble<br />
members, and the parenthetical subscripts indicate<br />
ranking of the ensemble members in ascending order<br />
(i.e., x(i) ≤ x(i+1) ≤ x(i+2), etc.).<br />
For q larger or smaller than all 25 ensemble members,<br />
the probability represented in the outlier bins of the rank<br />
histogram (i.e., in w 1 and w 26 ) must be extrapolated in<br />
some way.Some assumptions are made here.First,<br />
the rank histogram probability is uniformly distributed<br />
between the lowest ensemble member and zero.The<br />
lower tail is then fitted by (Hamill and Colucci, 1997):<br />
…..……..(3)<br />
For the upper tail, we assume that the probability<br />
beyond the largest ensemble member follows the<br />
shape of Gaussian distribution fitted to the ensemble<br />
data:<br />
…………..(4)<br />
where Z indicates standardization by subtraction of<br />
the (de-biased) ensemble mean and dividing by the<br />
ensemble standard deviation, and represents the<br />
Gaussian cumulative distribution function.<br />
The probability of a TC reaching a certain TC intensity<br />
category can then be obtained by replacing q in Eqn<br />
(2) – (4) with the maximum wind thresholds of the<br />
respective TC intensity category.<br />
Fig. 6 - Rank histogram for the maximum wind<br />
forecasts based on samples in 2003 and 2004.Left<br />
column: bias correction by simple bias removal; right<br />
column: bias correction by ANN.<br />
b. Verification<br />
The Brier score, BS, (Wilks, 1995) verifies the<br />
probability forecast Y against the event observation