

2001 Triple Bottom Line Report - BC Hydro
2001 Triple Bottom Line Report - BC Hydro
2001 Triple Bottom Line Report - BC Hydro

Create successful ePaper yourself
Turn your PDF publications into a flip-book with our unique Google optimized e-Paper software.
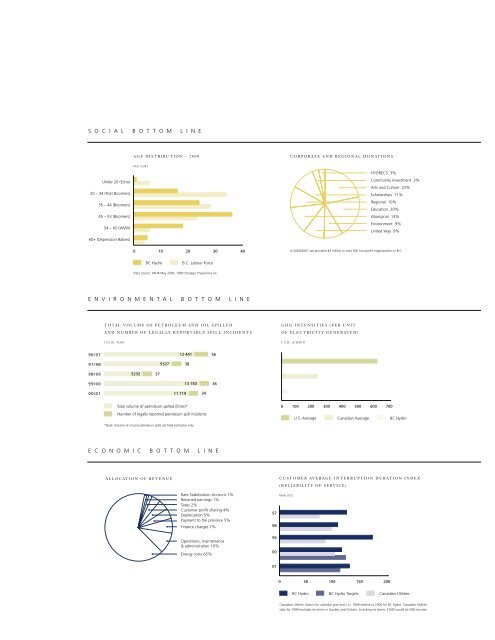
S O C I A L B O T T O M L I N E<br />
Under 20 (Echo)<br />
20 – 34 (Post Boomers)<br />
35 – 44 (Boomers)<br />
45 – 53 (Boomers)<br />
54 – 60 (WWII)<br />
60+ (Depression Babies)<br />
AGE DISTRIBUTION – 2000<br />
PER CENT<br />
0 10 20 30 40<br />
<strong>BC</strong> <strong>Hydro</strong> B.C. Labour Force<br />
Data Source: PAHR May 2000, 1999 Strategic Projections Inc.<br />
E N V I R O N M E N T A L B O T T O M L I N E<br />
96/97<br />
97/98<br />
98/99<br />
99/00<br />
00/01<br />
TOTAL VOLUME OF PETROLEUM AND OIL SPILLED<br />
AND NUMBER OF LEGALLY REPORTABLE SPILL INCIDENTS<br />
FISCAL YEAR<br />
5232<br />
12 441<br />
38<br />
E C O N O M I C B O T T O M L I N E<br />
37<br />
9327<br />
13 150<br />
11 714<br />
Total volume of petroleum spilled (litres)*<br />
Number of legally reported petroleum spill incidents<br />
*Note: Volume of oil and petroleum spills are field estimates only<br />
ALLOCATION OF REVENUE<br />
34<br />
56<br />
36<br />
Rate Stabilization Account 1%<br />
Retained earnings 1%<br />
Taxes 2%<br />
Customer profit sharing 4%<br />
Depreciation 5%<br />
Payment to the province 5%<br />
Finance charges 7%<br />
Operations, maintenance<br />
& administration 10%<br />
Energy costs 65%<br />
97<br />
98<br />
99<br />
00<br />
01<br />
CORPORATE AND REGIONAL DONATIONS<br />
HYDRECS 3%<br />
Community Investment 3%<br />
Arts and Culture 22%<br />
Scholarships 11%<br />
Regional 10%<br />
Education 20%<br />
Aboriginal 13%<br />
Environment 9%<br />
United Way 9%<br />
In 2000/<strong>2001</strong> we provided $3 million to over 500 non-profit organizations in B.C.<br />
GHG INTENSITIES (PER UNIT<br />
OF ELECTRICITY GENERATED)<br />
t CO2 e/GW . h<br />
0 100 200 300 400 500 600 700<br />
U.S. Average Canadian Average <strong>BC</strong> <strong>Hydro</strong><br />
CUSTOMER AVERAGE INTERRUPTION DURATION INDEX<br />
(RELIABILITY OF SERVICE)<br />
MINUTES<br />
0 50 100 150 200<br />
<strong>BC</strong> <strong>Hydro</strong> <strong>BC</strong> <strong>Hydro</strong> Targets<br />
Canadian Utilities<br />
Canadian Utilities’ data is for calendar year end, i.e., 1999 relative to 2000 for <strong>BC</strong> <strong>Hydro</strong>. Canadian Utilities’<br />
data for 1999 excludes ice storm in Quebec and Ontario. Including ice storm, CAIDI would be 508 minutes.


