Patterns of time use in Tanzania: how to make public investment in ...
Patterns of time use in Tanzania: how to make public investment in ...
Patterns of time use in Tanzania: how to make public investment in ...

You also want an ePaper? Increase the reach of your titles
YUMPU automatically turns print PDFs into web optimized ePapers that Google loves.
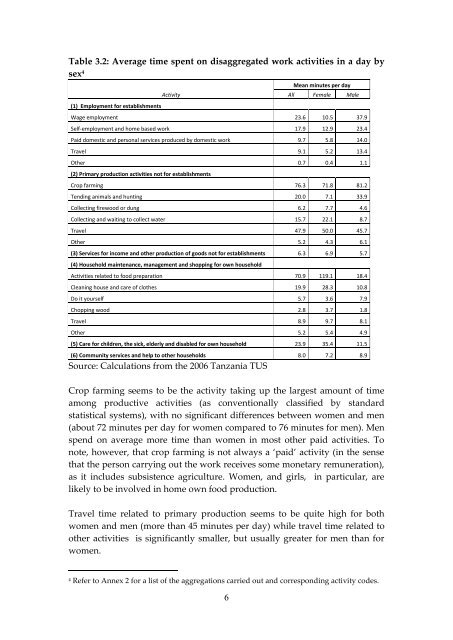
Table 3.2: Average <strong>time</strong> spent on disaggregated work activities <strong>in</strong> a day by<br />
sex 4<br />
(1) Employment for establishments<br />
Activity<br />
6<br />
Mean m<strong>in</strong>utes per day<br />
All Female Male<br />
Wage employment 23.6 10.5 37.9<br />
Self-employment and home based work 17.9 12.9 23.4<br />
Paid domestic and personal services produced by domestic work 9.7 5.8 14.0<br />
Travel 9.1 5.2 13.4<br />
Other 0.7 0.4 1.1<br />
(2) Primary production activities not for establishments<br />
Crop farm<strong>in</strong>g 76.3 71.8 81.2<br />
Tend<strong>in</strong>g animals and hunt<strong>in</strong>g 20.0 7.1 33.9<br />
Collect<strong>in</strong>g firewood or dung 6.2 7.7 4.6<br />
Collect<strong>in</strong>g and wait<strong>in</strong>g <strong>to</strong> collect water 15.7 22.1 8.7<br />
Travel 47.9 50.0 45.7<br />
Other 5.2 4.3 6.1<br />
(3) Services for <strong>in</strong>come and other production <strong>of</strong> goods not for establishments 6.3 6.9 5.7<br />
(4) Ho<strong>use</strong>hold ma<strong>in</strong>tenance, management and shopp<strong>in</strong>g for own ho<strong>use</strong>hold<br />
Activities related <strong>to</strong> food preparation 70.9 119.1 18.4<br />
Clean<strong>in</strong>g ho<strong>use</strong> and care <strong>of</strong> clothes 19.9 28.3 10.8<br />
Do it yourself 5.7 3.6 7.9<br />
Chopp<strong>in</strong>g wood 2.8 3.7 1.8<br />
Travel 8.9 9.7 8.1<br />
Other 5.2 5.4 4.9<br />
(5) Care for children, the sick, elderly and disabled for own ho<strong>use</strong>hold 23.9 35.4 11.5<br />
(6) Community services and help <strong>to</strong> other ho<strong>use</strong>holds 8.0 7.2 8.9<br />
Source: Calculations from the 2006 <strong>Tanzania</strong> TUS<br />
Crop farm<strong>in</strong>g seems <strong>to</strong> be the activity tak<strong>in</strong>g up the largest amount <strong>of</strong> <strong>time</strong><br />
among productive activities (as conventionally classified by standard<br />
statistical systems), with no significant differences between women and men<br />
(about 72 m<strong>in</strong>utes per day for women compared <strong>to</strong> 76 m<strong>in</strong>utes for men). Men<br />
spend on average more <strong>time</strong> than women <strong>in</strong> most other paid activities. To<br />
note, <strong>how</strong>ever, that crop farm<strong>in</strong>g is not always a ‘paid’ activity (<strong>in</strong> the sense<br />
that the person carry<strong>in</strong>g out the work receives some monetary remuneration),<br />
as it <strong>in</strong>cludes subsistence agriculture. Women, and girls, <strong>in</strong> particular, are<br />
likely <strong>to</strong> be <strong>in</strong>volved <strong>in</strong> home own food production.<br />
Travel <strong>time</strong> related <strong>to</strong> primary production seems <strong>to</strong> be quite high for both<br />
women and men (more than 45 m<strong>in</strong>utes per day) while travel <strong>time</strong> related <strong>to</strong><br />
other activities is significantly smaller, but usually greater for men than for<br />
women.<br />
4 Refer <strong>to</strong> Annex 2 for a list <strong>of</strong> the aggregations carried out and correspond<strong>in</strong>g activity codes.