Patterns of time use in Tanzania: how to make public investment in ...
Patterns of time use in Tanzania: how to make public investment in ...
Patterns of time use in Tanzania: how to make public investment in ...

Create successful ePaper yourself
Turn your PDF publications into a flip-book with our unique Google optimized e-Paper software.
Who are the ‘overburdened’?<br />
The tables presented <strong>in</strong> the previous sections helped <strong>to</strong> identify fac<strong>to</strong>rs that<br />
may affect the distribution <strong>of</strong> the burden <strong>of</strong> collect<strong>in</strong>g water between men and<br />
women. We saw, for example, that location as well as <strong>in</strong>come level matters.<br />
So far we presented only averages - either for the overall population or for the<br />
groups actually carry<strong>in</strong>g out the activity, but it is important <strong>to</strong> also take note<br />
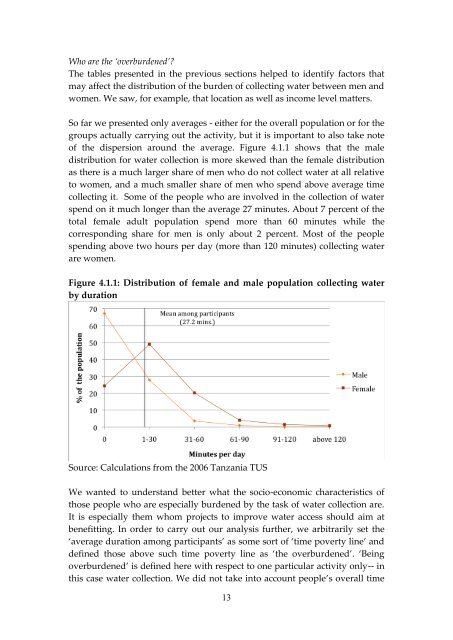
<strong>of</strong> the dispersion around the average. Figure 4.1.1 s<strong>how</strong>s that the male<br />
distribution for water collection is more skewed than the female distribution<br />
as there is a much larger share <strong>of</strong> men who do not collect water at all relative<br />
<strong>to</strong> women, and a much smaller share <strong>of</strong> men who spend above average <strong>time</strong><br />
collect<strong>in</strong>g it. Some <strong>of</strong> the people who are <strong>in</strong>volved <strong>in</strong> the collection <strong>of</strong> water<br />
spend on it much longer than the average 27 m<strong>in</strong>utes. About 7 percent <strong>of</strong> the<br />
<strong>to</strong>tal female adult population spend more than 60 m<strong>in</strong>utes while the<br />
correspond<strong>in</strong>g share for men is only about 2 percent. Most <strong>of</strong> the people<br />
spend<strong>in</strong>g above two hours per day (more than 120 m<strong>in</strong>utes) collect<strong>in</strong>g water<br />
are women.<br />
Figure 4.1.1: Distribution <strong>of</strong> female and male population collect<strong>in</strong>g water<br />
by duration<br />
Source: Calculations from the 2006 <strong>Tanzania</strong> TUS<br />
We wanted <strong>to</strong> understand better what the socio-economic characteristics <strong>of</strong><br />
those people who are especially burdened by the task <strong>of</strong> water collection are.<br />
It is especially them whom projects <strong>to</strong> improve water access should aim at<br />
benefitt<strong>in</strong>g. In order <strong>to</strong> carry out our analysis further, we arbitrarily set the<br />
‘average duration among participants’ as some sort <strong>of</strong> ‘<strong>time</strong> poverty l<strong>in</strong>e’ and<br />
def<strong>in</strong>ed those above such <strong>time</strong> poverty l<strong>in</strong>e as ‘the overburdened’. ‘Be<strong>in</strong>g<br />
overburdened’ is def<strong>in</strong>ed here with respect <strong>to</strong> one particular activity only-- <strong>in</strong><br />
this case water collection. We did not take <strong>in</strong><strong>to</strong> account people’s overall <strong>time</strong><br />
13