Patterns of time use in Tanzania: how to make public investment in ...
Patterns of time use in Tanzania: how to make public investment in ...
Patterns of time use in Tanzania: how to make public investment in ...

Create successful ePaper yourself
Turn your PDF publications into a flip-book with our unique Google optimized e-Paper software.
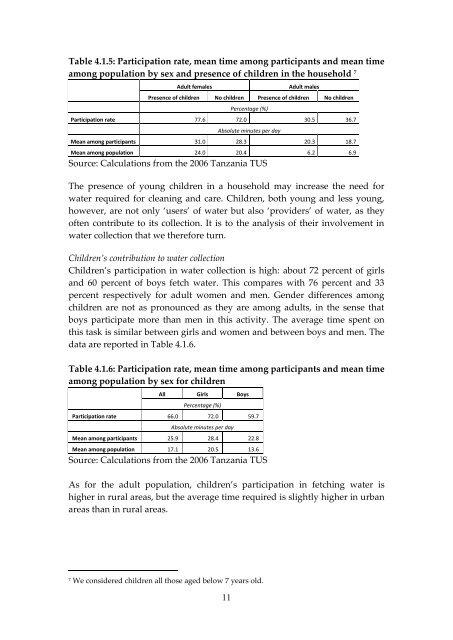
Table 4.1.5: Participation rate, mean <strong>time</strong> among participants and mean <strong>time</strong><br />
among population by sex and presence <strong>of</strong> children <strong>in</strong> the ho<strong>use</strong>hold 7<br />
Adult females Adult males<br />
Presence <strong>of</strong> children No children Presence <strong>of</strong> children No children<br />
11<br />
Percentage (%)<br />
Participation rate 77.6 72.0 30.5 36.7<br />
Absolute m<strong>in</strong>utes per day<br />
Mean among participants 31.0 28.3 20.3 18.7<br />
Mean among population 24.0 20.4 6.2 6.9<br />
Source: Calculations from the 2006 <strong>Tanzania</strong> TUS<br />
The presence <strong>of</strong> young children <strong>in</strong> a ho<strong>use</strong>hold may <strong>in</strong>crease the need for<br />
water required for clean<strong>in</strong>g and care. Children, both young and less young,<br />
<strong>how</strong>ever, are not only ‘<strong>use</strong>rs’ <strong>of</strong> water but also ‘providers’ <strong>of</strong> water, as they<br />
<strong>of</strong>ten contribute <strong>to</strong> its collection. It is <strong>to</strong> the analysis <strong>of</strong> their <strong>in</strong>volvement <strong>in</strong><br />
water collection that we therefore turn.<br />
Children’s contribution <strong>to</strong> water collection<br />
Children’s participation <strong>in</strong> water collection is high: about 72 percent <strong>of</strong> girls<br />
and 60 percent <strong>of</strong> boys fetch water. This compares with 76 percent and 33<br />
percent respectively for adult women and men. Gender differences among<br />
children are not as pronounced as they are among adults, <strong>in</strong> the sense that<br />
boys participate more than men <strong>in</strong> this activity. The average <strong>time</strong> spent on<br />
this task is similar between girls and women and between boys and men. The<br />
data are reported <strong>in</strong> Table 4.1.6.<br />
Table 4.1.6: Participation rate, mean <strong>time</strong> among participants and mean <strong>time</strong><br />
among population by sex for children<br />
All Girls Boys<br />
Percentage (%)<br />
Participation rate 66.0 72.0 59.7<br />
Absolute m<strong>in</strong>utes per day<br />
Mean among participants 25.9 28.4 22.8<br />
Mean among population 17.1 20.5 13.6<br />
Source: Calculations from the 2006 <strong>Tanzania</strong> TUS<br />
As for the adult population, children’s participation <strong>in</strong> fetch<strong>in</strong>g water is<br />
higher <strong>in</strong> rural areas, but the average <strong>time</strong> required is slightly higher <strong>in</strong> urban<br />
areas than <strong>in</strong> rural areas.<br />
7 We considered children all those aged below 7 years old.