Patterns of time use in Tanzania: how to make public investment in ...
Patterns of time use in Tanzania: how to make public investment in ...
Patterns of time use in Tanzania: how to make public investment in ...

You also want an ePaper? Increase the reach of your titles
YUMPU automatically turns print PDFs into web optimized ePapers that Google loves.
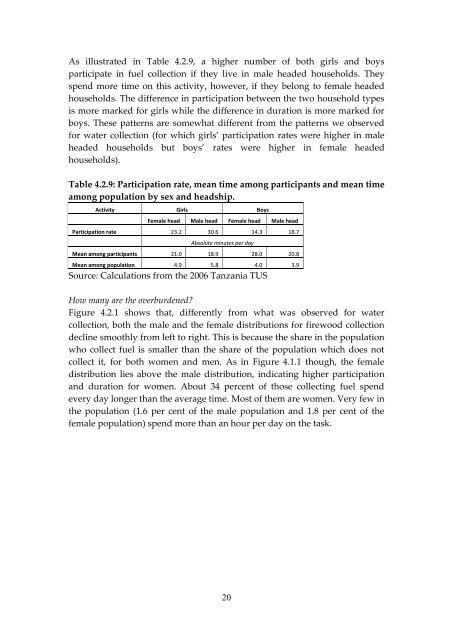
As illustrated <strong>in</strong> Table 4.2.9, a higher number <strong>of</strong> both girls and boys<br />
participate <strong>in</strong> fuel collection if they live <strong>in</strong> male headed ho<strong>use</strong>holds. They<br />
spend more <strong>time</strong> on this activity, <strong>how</strong>ever, if they belong <strong>to</strong> female headed<br />
ho<strong>use</strong>holds. The difference <strong>in</strong> participation between the two ho<strong>use</strong>hold types<br />
is more marked for girls while the difference <strong>in</strong> duration is more marked for<br />
boys. These patterns are somewhat different from the patterns we observed<br />
for water collection (for which girls’ participation rates were higher <strong>in</strong> male<br />
headed ho<strong>use</strong>holds but boys’ rates were higher <strong>in</strong> female headed<br />
ho<strong>use</strong>holds).<br />
Table 4.2.9: Participation rate, mean <strong>time</strong> among participants and mean <strong>time</strong><br />
among population by sex and headship.<br />
Activity Girls Boys<br />
Female head Male head Female head Male head<br />
Participation rate 23.2 30.6 14.3 18.7<br />
Absolute m<strong>in</strong>utes per day<br />
Mean among participants 21.0 18.9 28.0 20.8<br />
Mean among population 4.9 5.8 4.0 3.9<br />
Source: Calculations from the 2006 <strong>Tanzania</strong> TUS<br />
How many are the overburdened?<br />
Figure 4.2.1 s<strong>how</strong>s that, differently from what was observed for water<br />
collection, both the male and the female distributions for firewood collection<br />
decl<strong>in</strong>e smoothly from left <strong>to</strong> right. This is beca<strong>use</strong> the share <strong>in</strong> the population<br />
who collect fuel is smaller than the share <strong>of</strong> the population which does not<br />
collect it, for both women and men. As <strong>in</strong> Figure 4.1.1 though, the female<br />
distribution lies above the male distribution, <strong>in</strong>dicat<strong>in</strong>g higher participation<br />
and duration for women. About 34 percent <strong>of</strong> those collect<strong>in</strong>g fuel spend<br />
every day longer than the average <strong>time</strong>. Most <strong>of</strong> them are women. Very few <strong>in</strong><br />
the population (1.6 per cent <strong>of</strong> the male population and 1.8 per cent <strong>of</strong> the<br />
female population) spend more than an hour per day on the task.<br />
20