Patterns of time use in Tanzania: how to make public investment in ...
Patterns of time use in Tanzania: how to make public investment in ...
Patterns of time use in Tanzania: how to make public investment in ...
Create successful ePaper yourself
Turn your PDF publications into a flip-book with our unique Google optimized e-Paper software.
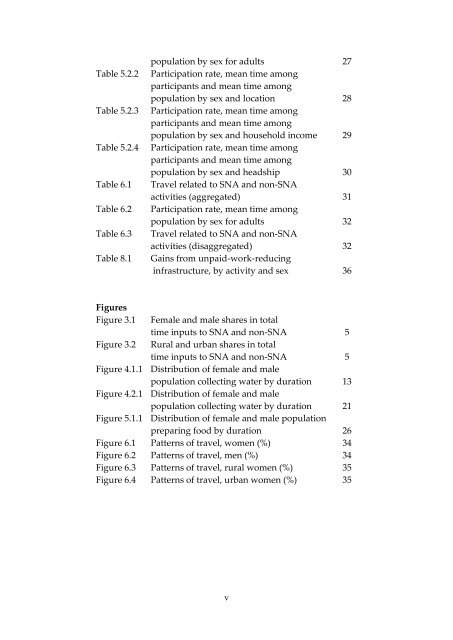
population by sex for adults 27<br />
Table 5.2.2 Participation rate, mean <strong>time</strong> among<br />
participants and mean <strong>time</strong> among<br />
population by sex and location 28<br />
Table 5.2.3 Participation rate, mean <strong>time</strong> among<br />
participants and mean <strong>time</strong> among<br />
population by sex and ho<strong>use</strong>hold <strong>in</strong>come 29<br />
Table 5.2.4 Participation rate, mean <strong>time</strong> among<br />
participants and mean <strong>time</strong> among<br />
population by sex and headship 30<br />
Table 6.1 Travel related <strong>to</strong> SNA and non-SNA<br />
activities (aggregated) 31<br />
Table 6.2 Participation rate, mean <strong>time</strong> among<br />
population by sex for adults 32<br />
Table 6.3 Travel related <strong>to</strong> SNA and non-SNA<br />
activities (disaggregated) 32<br />
Table 8.1 Ga<strong>in</strong>s from unpaid-work-reduc<strong>in</strong>g<br />
<strong>in</strong>frastructure, by activity and sex 36<br />
Figures<br />
Figure 3.1 Female and male shares <strong>in</strong> <strong>to</strong>tal<br />
<strong>time</strong> <strong>in</strong>puts <strong>to</strong> SNA and non-SNA 5<br />
Figure 3.2 Rural and urban shares <strong>in</strong> <strong>to</strong>tal<br />
<strong>time</strong> <strong>in</strong>puts <strong>to</strong> SNA and non-SNA 5<br />
Figure 4.1.1 Distribution <strong>of</strong> female and male<br />
population collect<strong>in</strong>g water by duration 13<br />
Figure 4.2.1 Distribution <strong>of</strong> female and male<br />
population collect<strong>in</strong>g water by duration 21<br />
Figure 5.1.1 Distribution <strong>of</strong> female and male population<br />
prepar<strong>in</strong>g food by duration 26<br />
Figure 6.1 <strong>Patterns</strong> <strong>of</strong> travel, women (%) 34<br />
Figure 6.2 <strong>Patterns</strong> <strong>of</strong> travel, men (%) 34<br />
Figure 6.3 <strong>Patterns</strong> <strong>of</strong> travel, rural women (%) 35<br />
Figure 6.4 <strong>Patterns</strong> <strong>of</strong> travel, urban women (%) 35<br />
v


