Patterns of time use in Tanzania: how to make public investment in ...
Patterns of time use in Tanzania: how to make public investment in ...
Patterns of time use in Tanzania: how to make public investment in ...

You also want an ePaper? Increase the reach of your titles
YUMPU automatically turns print PDFs into web optimized ePapers that Google loves.
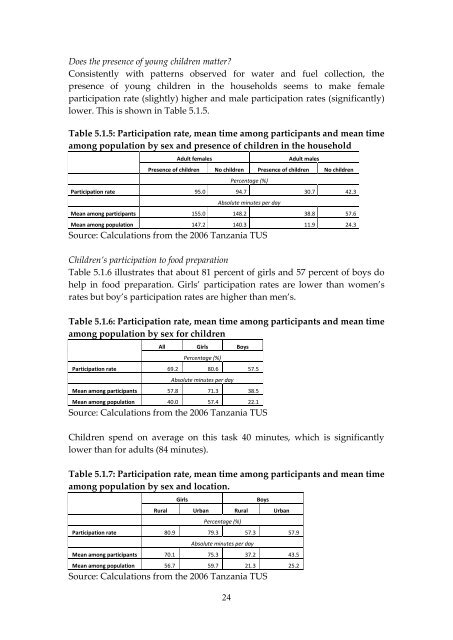
Does the presence <strong>of</strong> young children matter?<br />
Consistently with patterns observed for water and fuel collection, the<br />
presence <strong>of</strong> young children <strong>in</strong> the ho<strong>use</strong>holds seems <strong>to</strong> <strong>make</strong> female<br />
participation rate (slightly) higher and male participation rates (significantly)<br />
lower. This is s<strong>how</strong>n <strong>in</strong> Table 5.1.5.<br />
Table 5.1.5: Participation rate, mean <strong>time</strong> among participants and mean <strong>time</strong><br />
among population by sex and presence <strong>of</strong> children <strong>in</strong> the ho<strong>use</strong>hold<br />
Adult females Adult males<br />
Presence <strong>of</strong> children No children Presence <strong>of</strong> children No children<br />
24<br />
Percentage (%)<br />
Participation rate 95.0 94.7 30.7 42.3<br />
Absolute m<strong>in</strong>utes per day<br />
Mean among participants 155.0 148.2 38.8 57.6<br />
Mean among population 147.2 140.3 11.9 24.3<br />
Source: Calculations from the 2006 <strong>Tanzania</strong> TUS<br />
Children’s participation <strong>to</strong> food preparation<br />
Table 5.1.6 illustrates that about 81 percent <strong>of</strong> girls and 57 percent <strong>of</strong> boys do<br />
help <strong>in</strong> food preparation. Girls’ participation rates are lower than women’s<br />
rates but boy’s participation rates are higher than men’s.<br />
Table 5.1.6: Participation rate, mean <strong>time</strong> among participants and mean <strong>time</strong><br />
among population by sex for children<br />
All Girls Boys<br />
Percentage (%)<br />
Participation rate 69.2 80.6 57.5<br />
Absolute m<strong>in</strong>utes per day<br />
Mean among participants 57.8 71.3 38.5<br />
Mean among population 40.0 57.4 22.1<br />
Source: Calculations from the 2006 <strong>Tanzania</strong> TUS<br />
Children spend on average on this task 40 m<strong>in</strong>utes, which is significantly<br />
lower than for adults (84 m<strong>in</strong>utes).<br />
Table 5.1.7: Participation rate, mean <strong>time</strong> among participants and mean <strong>time</strong><br />
among population by sex and location.<br />
Girls Boys<br />
Rural Urban Rural Urban<br />
Percentage (%)<br />
Participation rate 80.9 79.3 57.3 57.9<br />
Absolute m<strong>in</strong>utes per day<br />
Mean among participants 70.1 75.3 37.2 43.5<br />
Mean among population 56.7 59.7 21.3 25.2<br />
Source: Calculations from the 2006 <strong>Tanzania</strong> TUS