Patterns of time use in Tanzania: how to make public investment in ...
Patterns of time use in Tanzania: how to make public investment in ...
Patterns of time use in Tanzania: how to make public investment in ...

Create successful ePaper yourself
Turn your PDF publications into a flip-book with our unique Google optimized e-Paper software.
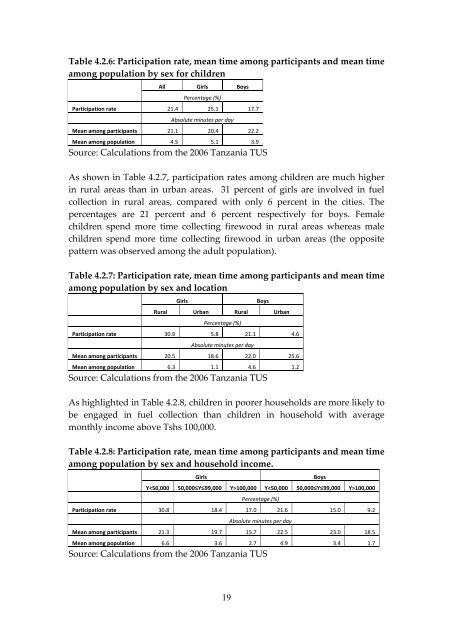
Table 4.2.6: Participation rate, mean <strong>time</strong> among participants and mean <strong>time</strong><br />
among population by sex for children<br />
All Girls Boys<br />
Percentage (%)<br />
Participation rate 21.4 25.1 17.7<br />
Absolute m<strong>in</strong>utes per day<br />
Mean among participants 21.1 20.4 22.2<br />
Mean among population 4.5 5.1 3.9<br />
Source: Calculations from the 2006 <strong>Tanzania</strong> TUS<br />
As s<strong>how</strong>n <strong>in</strong> Table 4.2.7, participation rates among children are much higher<br />
<strong>in</strong> rural areas than <strong>in</strong> urban areas. 31 percent <strong>of</strong> girls are <strong>in</strong>volved <strong>in</strong> fuel<br />
collection <strong>in</strong> rural areas, compared with only 6 percent <strong>in</strong> the cities. The<br />
percentages are 21 percent and 6 percent respectively for boys. Female<br />
children spend more <strong>time</strong> collect<strong>in</strong>g firewood <strong>in</strong> rural areas whereas male<br />
children spend more <strong>time</strong> collect<strong>in</strong>g firewood <strong>in</strong> urban areas (the opposite<br />
pattern was observed among the adult population).<br />
Table 4.2.7: Participation rate, mean <strong>time</strong> among participants and mean <strong>time</strong><br />
among population by sex and location<br />
Girls Boys<br />
Rural Urban Rural Urban<br />
Percentage (%)<br />
Participation rate 30.9 5.8 21.1 4.6<br />
Absolute m<strong>in</strong>utes per day<br />
Mean among participants 20.5 18.6 22.0 25.6<br />
Mean among population 6.3 1.1 4.6 1.2<br />
Source: Calculations from the 2006 <strong>Tanzania</strong> TUS<br />
As highlighted <strong>in</strong> Table 4.2.8, children <strong>in</strong> poorer ho<strong>use</strong>holds are more likely <strong>to</strong><br />
be engaged <strong>in</strong> fuel collection than children <strong>in</strong> ho<strong>use</strong>hold with average<br />
monthly <strong>in</strong>come above Tshs 100,000.<br />
Table 4.2.8: Participation rate, mean <strong>time</strong> among participants and mean <strong>time</strong><br />
among population by sex and ho<strong>use</strong>hold <strong>in</strong>come.<br />
Girls Boys<br />
Y100,000 Y100,000<br />
19<br />
Percentage (%)<br />
Participation rate 30.8 18.4 17.0 21.6 15.0 9.2<br />
Absolute m<strong>in</strong>utes per day<br />
Mean among participants 21.3 19.7 15.7 22.5 23.0 18.5<br />
Mean among population 6.6 3.6 2.7 4.9 3.4 1.7<br />
Source: Calculations from the 2006 <strong>Tanzania</strong> TUS