Patterns of time use in Tanzania: how to make public investment in ...
Patterns of time use in Tanzania: how to make public investment in ...
Patterns of time use in Tanzania: how to make public investment in ...

You also want an ePaper? Increase the reach of your titles
YUMPU automatically turns print PDFs into web optimized ePapers that Google loves.
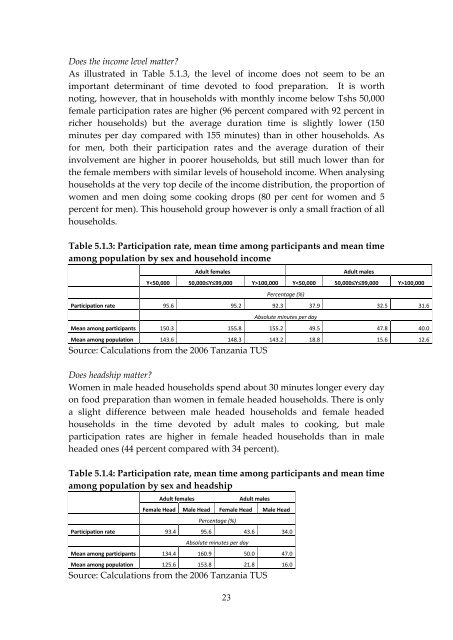
Does the <strong>in</strong>come level matter?<br />
As illustrated <strong>in</strong> Table 5.1.3, the level <strong>of</strong> <strong>in</strong>come does not seem <strong>to</strong> be an<br />
important determ<strong>in</strong>ant <strong>of</strong> <strong>time</strong> devoted <strong>to</strong> food preparation. It is worth<br />
not<strong>in</strong>g, <strong>how</strong>ever, that <strong>in</strong> ho<strong>use</strong>holds with monthly <strong>in</strong>come below Tshs 50,000<br />
female participation rates are higher (96 percent compared with 92 percent <strong>in</strong><br />
richer ho<strong>use</strong>holds) but the average duration <strong>time</strong> is slightly lower (150<br />
m<strong>in</strong>utes per day compared with 155 m<strong>in</strong>utes) than <strong>in</strong> other ho<strong>use</strong>holds. As<br />
for men, both their participation rates and the average duration <strong>of</strong> their<br />
<strong>in</strong>volvement are higher <strong>in</strong> poorer ho<strong>use</strong>holds, but still much lower than for<br />
the female members with similar levels <strong>of</strong> ho<strong>use</strong>hold <strong>in</strong>come. When analys<strong>in</strong>g<br />
ho<strong>use</strong>holds at the very <strong>to</strong>p decile <strong>of</strong> the <strong>in</strong>come distribution, the proportion <strong>of</strong><br />
women and men do<strong>in</strong>g some cook<strong>in</strong>g drops (80 per cent for women and 5<br />
percent for men). This ho<strong>use</strong>hold group <strong>how</strong>ever is only a small fraction <strong>of</strong> all<br />
ho<strong>use</strong>holds.<br />
Table 5.1.3: Participation rate, mean <strong>time</strong> among participants and mean <strong>time</strong><br />
among population by sex and ho<strong>use</strong>hold <strong>in</strong>come<br />
Adult females Adult males<br />
Y100,000 Y100,000<br />
23<br />
Percentage (%)<br />
Participation rate 95.6 95.2 92.3 37.9 32.5 31.6<br />
Absolute m<strong>in</strong>utes per day<br />
Mean among participants 150.3 155.8 155.2 49.5 47.8 40.0<br />
Mean among population 143.6 148.3 143.2 18.8 15.6 12.6<br />
Source: Calculations from the 2006 <strong>Tanzania</strong> TUS<br />
Does headship matter?<br />
Women <strong>in</strong> male headed ho<strong>use</strong>holds spend about 30 m<strong>in</strong>utes longer every day<br />
on food preparation than women <strong>in</strong> female headed ho<strong>use</strong>holds. There is only<br />
a slight difference between male headed ho<strong>use</strong>holds and female headed<br />
ho<strong>use</strong>holds <strong>in</strong> the <strong>time</strong> devoted by adult males <strong>to</strong> cook<strong>in</strong>g, but male<br />
participation rates are higher <strong>in</strong> female headed ho<strong>use</strong>holds than <strong>in</strong> male<br />
headed ones (44 percent compared with 34 percent).<br />
Table 5.1.4: Participation rate, mean <strong>time</strong> among participants and mean <strong>time</strong><br />
among population by sex and headship<br />
Adult females Adult males<br />
Female Head Male Head Female Head Male Head<br />
Percentage (%)<br />
Participation rate 93.4 95.6 43.6 34.0<br />
Absolute m<strong>in</strong>utes per day<br />
Mean among participants 134.4 160.9 50.0 47.0<br />
Mean among population 125.6 153.8 21.8 16.0<br />
Source: Calculations from the 2006 <strong>Tanzania</strong> TUS