

TRENDS AND IMPACTS OF FOREIGN INVESTMENT IN DEVELOPING COUNTRY AGRICULTURE
TRENDS AND IMPACTS OF FOREIGN INVESTMENT IN DEVELOPING COUNTRY AGRICULTURE
TRENDS AND IMPACTS OF FOREIGN INVESTMENT IN DEVELOPING COUNTRY AGRICULTURE

Create successful ePaper yourself
Turn your PDF publications into a flip-book with our unique Google optimized e-Paper software.
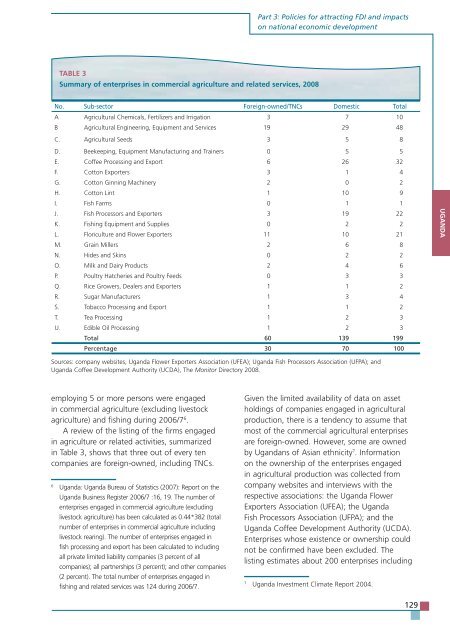
TABLE 3<br />
Summary of enterprises in commercial agriculture and related services, 2008<br />
employing 5 or more persons were engaged<br />
in commercial agriculture (excluding livestock<br />
agriculture) and fishing during 2006/7 6 .<br />
A review of the listing of the firms engaged<br />
in agriculture or related activities, summarized<br />
in Table 3, shows that three out of every ten<br />
companies are foreign-owned, including TNCs.<br />
6 Uganda: Uganda Bureau of Statistics (2007): Report on the<br />
Uganda Business Register 2006/7 :16, 19. The number of<br />
enterprises engaged in commercial agriculture (excluding<br />
livestock agriculture) has been calculated as 0.44*382 (total<br />
number of enterprises in commercial agriculture including<br />
livestock rearing). The number of enterprises engaged in<br />
fish processing and export has been calculated to including<br />
all private limited liability companies (3 percent of all<br />
companies); all partnerships (3 percent); and other companies<br />
(2 percent). The total number of enterprises engaged in<br />
fishing and related services was 124 during 2006/7.<br />
Part 3: Policies for attracting FDI and impacts<br />
on national economic development<br />
No. Sub-sector Foreign-owned/TNCs Domestic Total<br />
A Agricultural Chemicals, Fertilizers and Irrigation 3 7 10<br />
B Agricultural Engineering, Equipment and Services 19 29 48<br />
C. Agricultural Seeds 3 5 8<br />
D. Beekeeping, Equipment Manufacturing and Trainers 0 5 5<br />
E. Coffee Processing and Export 6 26 32<br />
F. Cotton Exporters 3 1 4<br />
G. Cotton Ginning Machinery 2 0 2<br />
H. Cotton Lint 1 10 9<br />
I. Fish Farms 0 1 1<br />
J. Fish Processors and Exporters 3 19 22<br />
K. Fishing Equipment and Supplies 0 2 2<br />
L. Floriculture and Flower Exporters 11 10 21<br />
M. Grain Millers 2 6 8<br />
N. Hides and Skins 0 2 2<br />
O. Milk and Dairy Products 2 4 6<br />
P. Poultry Hatcheries and Poultry Feeds 0 3 3<br />
Q. Rice Growers, Dealers and Exporters 1 1 2<br />
R. Sugar Manufacturers 1 3 4<br />
S. Tobacco Processing and Export 1 1 2<br />
T. Tea Processing 1 2 3<br />
U. Edible Oil Processing 1 2 3<br />
Total 60 139 199<br />
Percentage 30 70 100<br />
Sources: company websites, Uganda Flower Exporters Association (UFEA); Uganda Fish Processors Association (UFPA); and<br />
Uganda Coffee Development Authority (UCDA), The Monitor Directory 2008.<br />
Given the limited availability of data on asset<br />
holdings of companies engaged in agricultural<br />
production, there is a tendency to assume that<br />
most of the commercial agricultural enterprises<br />
are foreign-owned. However, some are owned<br />
by Ugandans of Asian ethnicity 7 . Information<br />
on the ownership of the enterprises engaged<br />
in agricultural production was collected from<br />
company websites and interviews with the<br />
respective associations: the Uganda Flower<br />
Exporters Association (UFEA); the Uganda<br />
Fish Processors Association (UFPA); and the<br />
Uganda Coffee Development Authority (UCDA).<br />
Enterprises whose existence or ownership could<br />
not be confirmed have been excluded. The<br />
listing estimates about 200 enterprises including<br />
7 Uganda Investment Climate Report 2004.<br />
129<br />
UG<strong>AND</strong>A