

TRENDS AND IMPACTS OF FOREIGN INVESTMENT IN DEVELOPING COUNTRY AGRICULTURE
TRENDS AND IMPACTS OF FOREIGN INVESTMENT IN DEVELOPING COUNTRY AGRICULTURE
TRENDS AND IMPACTS OF FOREIGN INVESTMENT IN DEVELOPING COUNTRY AGRICULTURE

Create successful ePaper yourself
Turn your PDF publications into a flip-book with our unique Google optimized e-Paper software.
BRAZIL<br />
Trends and impacts of foreign investment in<br />
developing country agriculture<br />
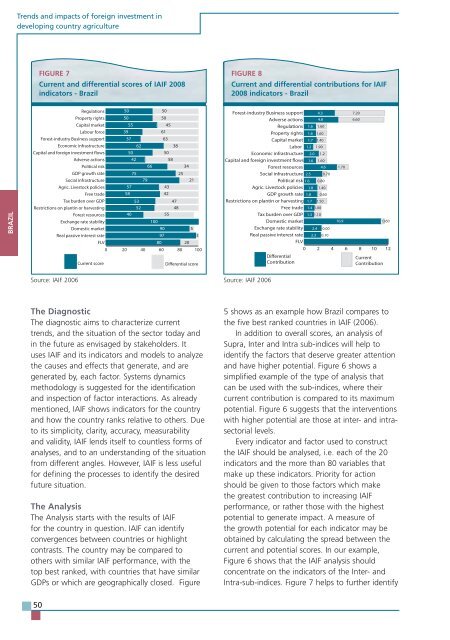
FIGURE 7<br />
Current and differential scores of IAIF 2008<br />
indicators - Brazil<br />
Regulations 50 50<br />
Property rights 50 50<br />
Capital market<br />
55 45<br />
Labour force 39 61<br />
Forest-industry Business support<br />
37 63<br />
Economic infrastructure<br />
62 38<br />
Capital and foreign investment flows<br />
50 50<br />
Adverse actions<br />
42 58<br />
Political risk<br />
66 34<br />
GDP growth rate<br />
75 25<br />
Social infrastructure<br />
79 21<br />
Agric. Livestock policies<br />
57 43<br />
Free trade<br />
58 42<br />
Tax burden over GDP<br />
53 47<br />
Restrictions on plantin or harvesting<br />
52 48<br />
Forest resources<br />
40 55<br />
Exchange rate stability<br />
100<br />
Domestic market<br />
90 5<br />
Real passive interest rate<br />
97 3<br />
FLV<br />
80 20<br />
0 20 40 60 80 100<br />
Source: IAIF 2006<br />
The Diagnostic<br />
The diagnostic aims to characterize current<br />
trends, and the situation of the sector today and<br />
in the future as envisaged by stakeholders. It<br />
uses IAIF and its indicators and models to analyze<br />
the causes and effects that generate, and are<br />
generated by, each factor. Systems dynamics<br />
methodology is suggested for the identification<br />
and inspection of factor interactions. As already<br />
mentioned, IAIF shows indicators for the country<br />
and how the country ranks relative to others. Due<br />
to its simplicity, clarity, accuracy, measurability<br />
and validity, IAIF lends itself to countless forms of<br />
analyses, and to an understanding of the situation<br />
from different angles. However, IAIF is less useful<br />
for defining the processes to identify the desired<br />
future situation.<br />
The Analysis<br />
The Analysis starts with the results of IAIF<br />
for the country in question. IAIF can identify<br />
convergences between countries or highlight<br />
contrasts. The country may be compared to<br />
others with similar IAIF performance, with the<br />
top best ranked, with countries that have similar<br />
GDPs or which are geographically closed. Figure<br />
50<br />
Current score<br />
Differential score<br />
FIGURE 8<br />
Current and differential contributions for IAIF<br />
2008 indicators - Brazil<br />
Forest-industry Business support 4.3 7.20<br />
Adverse actions 4.8 6.60<br />
Regulations 1.6 1.60<br />
Property rights 1.6 1.60<br />
Capital market 1.7 1.40<br />
Labor 1.2 1.90<br />
Economic infrastructure 2.0 1.2<br />
Capital and foreign investment flows 1.6 1.60<br />
Forest resources<br />
4.6 1.70<br />
Social infrastructure 2.5 0.70<br />
Political risk 1.6 0.80.80<br />
Agric. Livestock policies 1.8 1.40<br />
GDP growth rate 1.8 0.600<br />
Restrictions on plantin or harvesting 1.7 1.50<br />
Free trade 1.4 1.00<br />
Tax burden over GDP 1.3 1.10<br />
Domestic market<br />
10.9 0.6060<br />
Exchange rate stability 2.4 0.00<br />
Real passive interest rate<br />
FLV<br />
2.3 0.100 12<br />
0 2 4 6 8 10 12<br />
Differential<br />
Contribution<br />
Current<br />
Contribution<br />
Source: IAIF 2006<br />
5 shows as an example how Brazil compares to<br />
the five best ranked countries in IAIF (2006).<br />
In addition to overall scores, an analysis of<br />
Supra, Inter and Intra sub-indices will help to<br />
identify the factors that deserve greater attention<br />
and have higher potential. Figure 6 shows a<br />
simplified example of the type of analysis that<br />
can be used with the sub-indices, where their<br />
current contribution is compared to its maximum<br />
potential. Figure 6 suggests that the interventions<br />
with higher potential are those at inter- and intrasectorial<br />
levels.<br />
Every indicator and factor used to construct<br />
the IAIF should be analysed, i.e. each of the 20<br />
indicators and the more than 80 variables that<br />
make up these indicators. Priority for action<br />
should be given to those factors which make<br />
the greatest contribution to increasing IAIF<br />
performance, or rather those with the highest<br />
potential to generate impact. A measure of<br />
the growth potential for each indicator may be<br />
obtained by calculating the spread between the<br />
current and potential scores. In our example,<br />
Figure 6 shows that the IAIF analysis should<br />
concentrate on the indicators of the Inter- and<br />
Intra-sub-indices. Figure 7 helps to further identify