

TRENDS AND IMPACTS OF FOREIGN INVESTMENT IN DEVELOPING COUNTRY AGRICULTURE
TRENDS AND IMPACTS OF FOREIGN INVESTMENT IN DEVELOPING COUNTRY AGRICULTURE
TRENDS AND IMPACTS OF FOREIGN INVESTMENT IN DEVELOPING COUNTRY AGRICULTURE

Create successful ePaper yourself
Turn your PDF publications into a flip-book with our unique Google optimized e-Paper software.
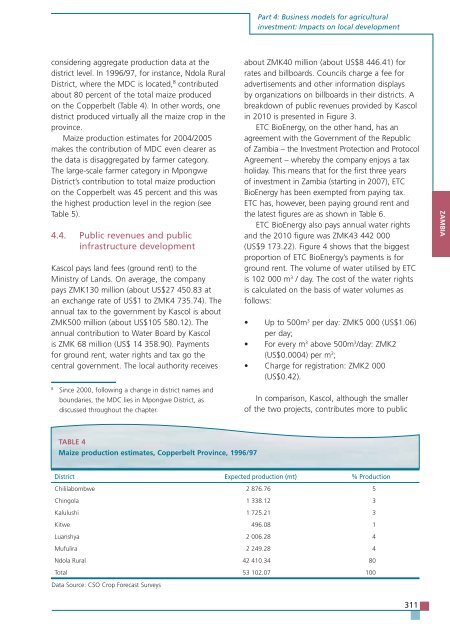
considering aggregate production data at the<br />
district level. In 1996/97, for instance, Ndola Rural<br />
District, where the MDC is located, 8 contributed<br />
about 80 percent of the total maize produced<br />
on the Copperbelt (Table 4). In other words, one<br />
district produced virtually all the maize crop in the<br />
province.<br />
Maize production estimates for 2004/2005<br />
makes the contribution of MDC even clearer as<br />
the data is disaggregated by farmer category.<br />
The large-scale farmer category in Mpongwe<br />
District’s contribution to total maize production<br />
on the Copperbelt was 45 percent and this was<br />
the highest production level in the region (see<br />
Table 5).<br />
4.4. Public revenues and public<br />
infrastructure development<br />
Kascol pays land fees (ground rent) to the<br />
Ministry of Lands. On average, the company<br />
pays ZMK130 million (about US$27 450.83 at<br />
an exchange rate of US$1 to ZMK4 735.74). The<br />
annual tax to the government by Kascol is about<br />
ZMK500 million (about US$105 580.12). The<br />
annual contribution to Water Board by Kascol<br />
is ZMK 68 million (US$ 14 358.90). Payments<br />
for ground rent, water rights and tax go the<br />
central government. The local authority receives<br />
8 Since 2000, following a change in district names and<br />
boundaries, the MDC lies in Mpongwe District, as<br />
discussed throughout the chapter.<br />
TABLE 4<br />
Maize production estimates, Copperbelt Province, 1996/97<br />
Data Source: CSO Crop Forecast Surveys<br />
Part 4: Business models for agricultural<br />
investment: Impacts on local development<br />
about ZMK40 million (about US$8 446.41) for<br />
rates and billboards. Councils charge a fee for<br />
advertisements and other information displays<br />
by organizations on billboards in their districts. A<br />
breakdown of public revenues provided by Kascol<br />
in 2010 is presented in Figure 3.<br />
ETC BioEnergy, on the other hand, has an<br />
agreement with the Government of the Republic<br />
of Zambia – the Investment Protection and Protocol<br />
Agreement – whereby the company enjoys a tax<br />
holiday. This means that for the first three years<br />
of investment in Zambia (starting in 2007), ETC<br />
BioEnergy has been exempted from paying tax.<br />
ETC has, however, been paying ground rent and<br />
the latest figures are as shown in Table 6.<br />
ETC BioEnergy also pays annual water rights<br />
and the 2010 figure was ZMK43 442 000<br />
(US$9 173.22). Figure 4 shows that the biggest<br />
proportion of ETC BioEnergy’s payments is for<br />
ground rent. The volume of water utilised by ETC<br />
is 102 000 m 3 / day. The cost of the water rights<br />
is calculated on the basis of water volumes as<br />
follows:<br />
Up to 500m 3 per day: ZMK5 000 (US$1.06)<br />
per day;<br />
For every m 3 above 500m 3 /day: ZMK2<br />
(US$0.0004) per m 3 ;<br />
Charge for registration: ZMK2 000<br />
(US$0.42).<br />
In comparison, Kascol, although the smaller<br />
of the two projects, contributes more to public<br />
District Expected production (mt) % Production<br />
Chililabombwe 2 876.76 5<br />
Chingola 1 338.12 3<br />
Kalulushi 1 725.21 3<br />
Kitwe 496.08 1<br />
Luanshya 2 006.28 4<br />
Mufulira 2 249.28 4<br />
Ndola Rural 42 410.34 80<br />
Total 53 102.07 100<br />
311<br />
ZAMBIA