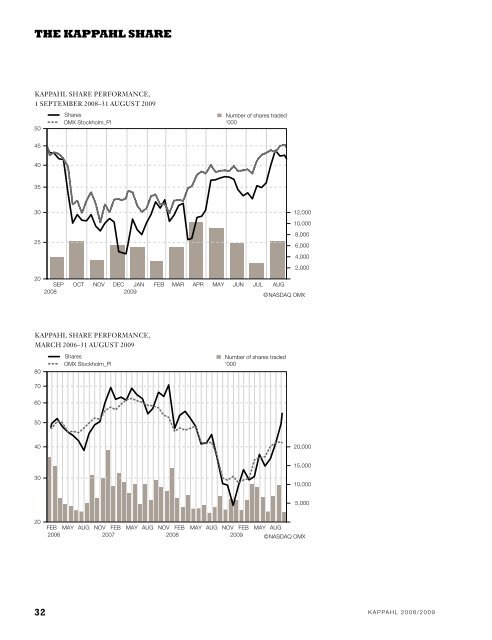
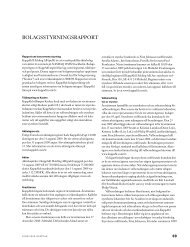
THE KAPPAHL SHARE KAPPAHL SHARE PERFORMANCE, 1 SEPTEMBER 2008–31 AUGUST 2009 50 45 40 35 30 25 20 32 Shares OMX Stockholm_PI SEP OCT NOV DEC JAN FEB MAR APR MAY JUN JUL AUG 2008 2009 ©NASDAQ OMX KAPPAHL SHARE PERFORMANCE, MARCH 2006–31 AUGUST 2009 80 70 60 50 40 30 20 Shares OMX Stockholm_PI Number of shares traded ‘000 Number of shares traded ‘000 12,000 10,000 8,000 6,000 4,000 2,000 20,000 15,000 10,000 FEB MAY AUG NOV FEB MAY AUG NOV FEB MAY AUG NOV FEB MAY AUG 2006 2007 2008 2009 ©NASDAQ OMX 5,000 Kappahl 2008/2009
Multi-year and quarterly review KEY RATIOS Sept–Aug 2008/2009 Sept–Aug 2007/2008 Sept–Aug 2006/2007 Sept–Aug 2005/2006 Sept–Aug 2004/2005 1 Sales growth, % 5.3% 3.3% 6.1% 6.9% – Operating profit (EBIT) 526 651 618 530 403 Total depreciation/amortisation 234 221 200 177 152 Gross margin, % 61.1 62.4% 61.1% 60.2% 58.6% Operating margin, % 10.8 14.1% 13.8% 12.6% 10.2% Interest coverage ratio (multiple) 6.27 8.48 6.61 4.71 3.75 Net interest-bearing liabilities 2,100 1,979 1,387 1,605 1,685 Net interest-bearing liabilities/EBITDa (multiple) 2.76 2.27 1.70 2.27 3.04 Equity/assets ratio, % 11.3% 16.4% 28.0% 14.3% 9.7% Equity per share, SEK 5.05 7.09 11.86 5.49 3.78 Equity per share after dilution, SEK 5.05 7.09 11.86 5.49 3.78 Cash flow from operating activities per share 6.71 9.73 8.89 6.31 10.19 Market price, SEK 41.60 44.80 64.75 49.70 – Market value, SEK m 3,122 3,362 4,859 3,729 – p/E ratio (multiple) 9.9 7.7 7.4 12.4 – Dividend yield, % 3.0% 10.0% 17.0% 5.0% – price/equity, % 824% 633% 546% 905% – Earnings per share, SEK 4.20 5.81 8.78 4.02 3.52 Dividend per share (proposed 2008/2009) 1.25 4.50 11.0 2 2.50 2.25 3 Dividend payout ratio, % 29.7% 77.5% 125.3% 62.1% 64.0% 3 Number of shares at close of period 75,040,000 75,040,000 75,040,000 75,040,000 10,366,000 Number of shares after dilution 75,040,000 75,040,000 75,040,000 75,040,000 10,366,000 1 The figures for the period September 2004–august 2005 are proforma and consequently not audited. The Group Kappahl holding aB (publ) was established in December 2004 and the first financial year for the Group consisted of the eight months January–august 2005. Consequently the multi-year reviews above do not contain more years for comparison. 2 Referred to redemption of shares. 3 Dividend based on the number of shares at the time of listing; 75,040,000. Dividend payout ratio is calculated as a percentage of 12-month profit for September 2004–august 2005. CONDENSED CONSOLIDATED INCOME STATEMENT (SEK m) Sept–Aug 2008/2009 Sept–Aug 2007/2008 Sept–Aug 2006/2007 Sept–Aug 2005/2006 Sept–Aug 2004/2005 1 Net sales 4,866 4,622 4,473 4,217 3,945 Cost of goods sold –1,893 –1,740 –1,738 –1,677 –1,635 Gross profit 2,973 2,882 2,735 2,540 2,310 Selling expenses –2,315 –2,106 –1,985 –1,863 –1,781 administrative expenses –132 –136 –142 –147 –126 Other operating income – 11 16 – – Other operating expenses – – –6 – – Operating profit 526 651 618 530 403 Financial income 1 27 23 2 6 Financial expenses –84 –80 –97 –113 –109 Profit/loss after financial items 443 598 544 419 300 Tax –127 –162 115 –117 –36 Profit after tax 315 436 659 302 264 1 The figures for the period September 2004–august 2005 are proforma and consequently not audited. The Group Kappahl holding aB (publ) was established in December 2004 and the first financial year for the Group consisted of the eight months January–august 2005. Consequently the multi-year reviews above do not contain more years for comparison. 2008/2009 Kappahl 33