We - KappAhl
We - KappAhl
We - KappAhl

Create successful ePaper yourself
Turn your PDF publications into a flip-book with our unique Google optimized e-Paper software.
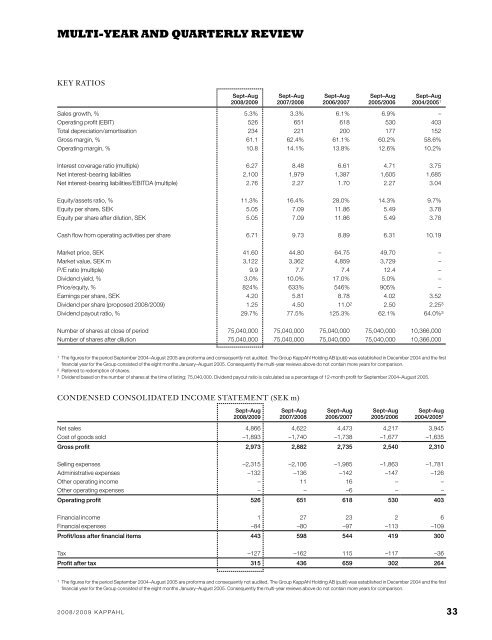
Multi-year and quarterly review<br />
KEY RATIOS<br />
Sept–Aug<br />
2008/2009<br />
Sept–Aug<br />
2007/2008<br />
Sept–Aug<br />
2006/2007<br />
Sept–Aug<br />
2005/2006<br />
Sept–Aug<br />
2004/2005 1<br />
Sales growth, % 5.3% 3.3% 6.1% 6.9% –<br />
Operating profit (EBIT) 526 651 618 530 403<br />
Total depreciation/amortisation 234 221 200 177 152<br />
Gross margin, % 61.1 62.4% 61.1% 60.2% 58.6%<br />
Operating margin, % 10.8 14.1% 13.8% 12.6% 10.2%<br />
Interest coverage ratio (multiple) 6.27 8.48 6.61 4.71 3.75<br />
Net interest-bearing liabilities 2,100 1,979 1,387 1,605 1,685<br />
Net interest-bearing liabilities/EBITDa (multiple) 2.76 2.27 1.70 2.27 3.04<br />
Equity/assets ratio, % 11.3% 16.4% 28.0% 14.3% 9.7%<br />
Equity per share, SEK 5.05 7.09 11.86 5.49 3.78<br />
Equity per share after dilution, SEK 5.05 7.09 11.86 5.49 3.78<br />
Cash flow from operating activities per share 6.71 9.73 8.89 6.31 10.19<br />
Market price, SEK 41.60 44.80 64.75 49.70 –<br />
Market value, SEK m 3,122 3,362 4,859 3,729 –<br />
p/E ratio (multiple) 9.9 7.7 7.4 12.4 –<br />
Dividend yield, % 3.0% 10.0% 17.0% 5.0% –<br />
price/equity, % 824% 633% 546% 905% –<br />
Earnings per share, SEK 4.20 5.81 8.78 4.02 3.52<br />
Dividend per share (proposed 2008/2009) 1.25 4.50 11.0 2 2.50 2.25 3<br />
Dividend payout ratio, % 29.7% 77.5% 125.3% 62.1% 64.0% 3<br />
Number of shares at close of period 75,040,000 75,040,000 75,040,000 75,040,000 10,366,000<br />
Number of shares after dilution 75,040,000 75,040,000 75,040,000 75,040,000 10,366,000<br />
1 The figures for the period September 2004–august 2005 are proforma and consequently not audited. The Group Kappahl holding aB (publ) was established in December 2004 and the first<br />
financial year for the Group consisted of the eight months January–august 2005. Consequently the multi-year reviews above do not contain more years for comparison.<br />
2 Referred to redemption of shares.<br />
3 Dividend based on the number of shares at the time of listing; 75,040,000. Dividend payout ratio is calculated as a percentage of 12-month profit for September 2004–august 2005.<br />
CONDENSED CONSOLIDATED INCOME STATEMENT (SEK m)<br />
Sept–Aug<br />
2008/2009<br />
Sept–Aug<br />
2007/2008<br />
Sept–Aug<br />
2006/2007<br />
Sept–Aug<br />
2005/2006<br />
Sept–Aug<br />
2004/2005 1<br />
Net sales 4,866 4,622 4,473 4,217 3,945<br />
Cost of goods sold –1,893 –1,740 –1,738 –1,677 –1,635<br />
Gross profit 2,973 2,882 2,735 2,540 2,310<br />
Selling expenses –2,315 –2,106 –1,985 –1,863 –1,781<br />
administrative expenses –132 –136 –142 –147 –126<br />
Other operating income – 11 16 – –<br />
Other operating expenses – – –6 – –<br />
Operating profit 526 651 618 530 403<br />
Financial income 1 27 23 2 6<br />
Financial expenses –84 –80 –97 –113 –109<br />
Profit/loss after financial items 443 598 544 419 300<br />
Tax –127 –162 115 –117 –36<br />
Profit after tax 315 436 659 302 264<br />
1 The figures for the period September 2004–august 2005 are proforma and consequently not audited. The Group Kappahl holding aB (publ) was established in December 2004 and the first<br />
financial year for the Group consisted of the eight months January–august 2005. Consequently the multi-year reviews above do not contain more years for comparison.<br />
2008/2009 Kappahl 33