2011 Infrastructure Real Estate Energy Logistics and Transport Services - Page 103 - Urban and Environmental Services Other Businesses Intra-<strong>Group</strong> transactions Extraordinary items Depreciation and amortisation charge and change in provisions and allowances Impairment and gains or (78,774) (8,337) (526,707) (54,293) (24,833) (5,728) 1,406 (20,080) (717,346) losses on disposals of noncurrent assets 7,607 1,215 (2,499) (1,256) (1,092) 565 -- 29,173 33,713 Other gains or losses (3,748) -- 3,737 3,851 (463) 25 -- -- 3,402 Profit (Loss) from operations 140,122 4,586 430,132 (27,127) 28,234 49,922 (3,271) 9,093 631,691 Finance income 44,637 1,255 11,029 1,463 4,121 32,883 (38,182) -- 57,206 Finance costs Result of companies (61,736) (56,205) (342,760) (10,595) (14,748) (25,138) 38,845 2,491 (469,846) accounted for using the equity method 142 (247) 2,344 2,626 (43) -- -- -- 4,822 Profit (Loss) before tax 123,165 (50,611) 100,745 (33,633) 17,564 57,667 (2,608) 11,584 223,873 Income tax expense (30,513) 15,223 (23,772) 5,785 (1,537) (17,104) 784 (2,317) (53,451) <strong>Consolidated</strong> profit (loss) for the year Profit after tax of discontinued operations Total <strong>Group</strong> 92,652 (35,388) 76,973 (27,848) 16,027 40,563 (1,824) 9,267 170,422 -- -- -- -- -- -- -- -- -- Profit (Loss) for the year 92,652 (35,388) 76,973 (27,848) 16,027 40,563 (1,824) 9,267 170,422 Non-controlling interests 15,261 735 (1,967) 18,432 -- -- (821) -- 31,640 Profit (Loss) attributable to the Parent ASSETS 107,913 (34,653) 75,006 (9,416) 16,027 40,563 (2,645) 9,267 202,062 2010 Infrastructure Real Estate Energy Logistics and Transport Services Urban and Environmental Services Other Businesses Intra-<strong>Group</strong> transactions Extraordinary items Property, plant and equipment, intangible assets and investment property 401,343 408,682 9,582,278 604,297 185,554 44,287 (40,340) -- 11,186,101 Goodwill 386 13,253 890,449 31,525 113,783 -- -- -- 1,049,396 Non-current financial assets 10,597 15,147 25,956 107,620 8,478 52,110 4,116 -- 224,024 Investments accounted for using the equity method 58,498 3,634 7,136 6,585 130 1 -- -- 75,984 Other assets 395,734 14,797 319,836 16,898 83,959 228,030 20,460 -- 1,079,714 Non-current assets 866,558 455,513 10,825,655 766,925 391,904 324,428 (15,764) -- 13,615,219 Inventories 169,701 1,064,601 360,135 10,757 11,557 25,766 (26,116) -- 1,616,401 Trade and other receivables 1,444,840 17,507 744,263 162,785 310,965 169,481 (480,879) -- 2,368,962 Other current financial assets 28,570 138 109,668 105,563 2,458 9,507 -- -- 255,904 Other assets 79,204 8,800 121,267 14,337 16,247 58,307 -- -- 298,162 Cash and cash equivalents 1,104,242 (607,540) (1,592,807) (296,951) (24,869) 2,790,659 (4,116) -- 1,368,618 Non-current assets classified as held for sale 495,729 410,552 -- 77,326 -- -- (4,682) -- 978,925 Current assets 3,322,286 894,058 (257,474) 73,817 316,358 3,053,720 (515,793) -- 6,886,972 Total assets 4,188,844 1,349,571 10,568,181 840,742 708,262 3,378,148 (531,557) -- 20,502,191 EQUITY <strong>AND</strong> LIABILITIES <strong>Consolidated</strong> equity 787,193 142,013 2,600,853 149,286 185,589 2,249,141 (50,678) -- 6,063,397 Bank borrowings and other financial liabilities Total <strong>Group</strong> 435,391 368,422 3,607,603 173,464 109,074 302,365 -- -- 4,996,319
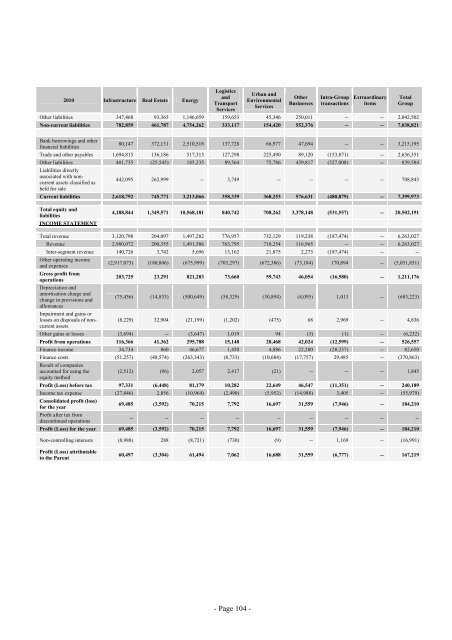
2010 Infrastructure Real Estate Energy Logistics and Transport Services - Page 104 - Urban and Environmental Services Other Businesses Intra-<strong>Group</strong> transactions Extraordinary items Other liabilities 347,468 93,365 1,146,659 159,653 45,346 250,011 -- -- 2,042,502 Non-current liabilities 782,859 461,787 4,754,262 333,117 154,420 552,376 -- -- 7,038,821 Bank borrowings and other financial liabilities 80,147 372,131 2,510,518 137,728 66,977 47,694 -- -- 3,215,195 Trade and other payables 1,694,815 136,186 517,313 127,298 225,490 89,120 (153,871) -- 2,636,351 Other liabilities Liabilities directly 401,735 (25,545) 185,235 89,564 75,786 439,817 (327,008) -- 839,584 associated with noncurrent assets classified as held for sale 442,095 262,999 -- 3,749 -- -- -- -- 708,843 Current liabilities 2,618,792 745,771 3,213,066 358,339 368,253 576,631 (480,879) -- 7,399,973 Total equity and liabilities INCOME STATEMENT Total <strong>Group</strong> 4,188,844 1,349,571 10,568,181 840,742 708,262 3,378,148 (531,557) -- 20,502,191 Total revenue 3,120,798 204,097 1,497,282 776,957 732,129 119,238 (187,474) -- 6,263,027 Revenue 2,980,072 200,355 1,491,586 763,795 710,254 116,965 -- -- 6,263,027 Inter-segment revenue 140,726 3,742 5,696 13,162 21,875 2,273 (187,474) -- -- Other operating income and expenses (2,917,073) (180,806) (675,999) (703,297) (672,386) (73,184) 170,894 -- (5,051,851) Gross profit from operations Depreciation and 203,725 23,291 821,283 73,660 59,743 46,054 (16,580) -- 1,211,176 amortisation charge and change in provisions and allowances Impairment and gains or (75,436) (14,833) (500,649) (58,329) (30,894) (4,095) 1,013 -- (683,223) losses on disposals of noncurrent assets (8,229) 32,904 (21,199) (1,202) (475) 68 2,969 -- 4,836 Other gains or losses (3,694) -- (3,647) 1,019 94 (3) (1) -- (6,232) Profit from operations 116,366 41,362 295,788 15,148 28,468 42,024 (12,599) -- 526,557 Finance income 34,734 860 46,677 1,450 4,886 22,280 (28,237) -- 82,650 Finance costs Result of companies (51,257) (48,574) (263,343) (8,733) (10,684) (17,757) 29,485 -- (370,863) accounted for using the equity method (2,512) (96) 2,057 2,417 (21) -- -- -- 1,845 Profit (Loss) before tax 97,331 (6,448) 81,179 10,282 22,649 46,547 (11,351) -- 240,189 Income tax expense (27,846) 2,856 (10,964) (2,490) (5,952) (14,988) 3,405 -- (55,979) <strong>Consolidated</strong> profit (loss) for the year Profit after tax from discontinued operations 69,485 (3,592) 70,215 7,792 16,697 31,559 (7,946) -- 184,210 -- -- -- -- -- -- -- -- -- Profit (Loss) for the year 69,485 (3,592) 70,215 7,792 16,697 31,559 (7,946) -- 184,210 Non-controlling interests (8,988) 288 (8,721) (730) (9) -- 1,169 -- (16,991) Profit (Loss) attributable to the Parent 60,497 (3,304) 61,494 7,062 16,688 31,559 (6,777) -- 167,219
- Page 1:
ACCIONA, S.A. AND SUBSIDIARIES (Con
- Page 4 and 5:
17. PROVISIONS 18. BANK BORROWINGS
- Page 6 and 7:
Translation of consolidated financi
- Page 8 and 9:
Translation of consolidated financi
- Page 10 and 11:
Beginning balance at 01/01/10 Adjus
- Page 12 and 13:
Translation of consolidated financi
- Page 14 and 15:
The Acciona Group's consolidated fi
- Page 16 and 17:
The financial statements of jointly
- Page 18 and 19:
Standards, amendments and interpret
- Page 20 and 21:
3.2 Accounting policies The princip
- Page 22 and 23:
The assets and liabilities acquired
- Page 24 and 25:
- The infrastructure is operated by
- Page 26 and 27:
Goodwill of companies The Acciona G
- Page 28 and 29:
The rates used, by division and cou
- Page 30 and 31:
- The concession operator receives
- Page 32 and 33:
- At fair value when it is possible
- Page 34 and 35:
Group policy on hedging: At the inc
- Page 36 and 37:
These assets are valued at the cost
- Page 38 and 39:
At 31 December 2010, Acciona, S.A.
- Page 40 and 41:
For each of the plans, any positive
- Page 42 and 43:
Machinery whose useful life exceeds
- Page 44 and 45:
The deferred tax assets and liabili
- Page 46 and 47:
These assets or disposal groups are
- Page 48 and 49:
- The results for tax purposes of t
- Page 50 and 51:
At 31 December 2011, the Group comp
- Page 52 and 53:
6.- Goodwill The changes in 2010 in
- Page 54 and 55: In 2011, as in 2010, the main addit
- Page 56 and 57: The Acciona Group's interests in as
- Page 58 and 59: - Page 57 - Non-current Current Bal
- Page 60 and 61: In 2011, since the lease expired, t
- Page 62 and 63: At 31 December 2011, the Group comp
- Page 64 and 65: The breakdown, by type of customer,
- Page 66 and 67: c) Treasury shares The changes in 2
- Page 68 and 69: The changes in the balance of this
- Page 70 and 71: Leverage Millions of euros 2011 201
- Page 72 and 73: isks and uncertainties which, inevi
- Page 74 and 75: Provision for other longterm employ
- Page 76 and 77: of obtaining the related waivers, d
- Page 78 and 79: Foreign currency risk 31/12/11 +0.5
- Page 80 and 81: Economic risk vs. budget variances
- Page 82 and 83: In 2011, through its subsidiary Com
- Page 84 and 85: Summary of effects on valuation adj
- Page 86 and 87: 22.- Other non-current and current
- Page 88 and 89: On 12 February 2009, this Tribunal
- Page 90 and 91: Reconciliation of the accounting pr
- Page 92 and 93: At 2011 year-end, the period for of
- Page 94 and 95: - Merger by absorption of Grupo Ent
- Page 96 and 97: The detail of the cumulative income
- Page 98 and 99: The breakdown, by geographical area
- Page 100 and 101: 27.- Expenses The detail of the Gro
- Page 102 and 103: 2011 (thousands of euros) Vessel Da
- Page 106 and 107: The detail of certain of the Group'
- Page 108 and 109: C) ENERGY. In addition to the costs
- Page 110 and 111: Expenses and income Significant sha
- Page 112 and 113: 35.- Remuneration and other benefit
- Page 114 and 115: a) For each director belonging to t
- Page 116 and 117: Beneficiaries: those persons who, a
- Page 118 and 119: Vicente Santamaría de Paredes Cast
- Page 120 and 121: 36.- Other disclosures concerning t
- Page 122 and 123: APPENDIX I GROUP COMPANIES The subs
- Page 124 and 125: Group company Auditor Location Main
- Page 126 and 127: Group company Auditor Location Main
- Page 128 and 129: Group company Auditor Location Main
- Page 130 and 131: Group company Auditor Location Main
- Page 132 and 133: Group company Auditor Operadora de
- Page 134 and 135: Group company Auditor Location Main
- Page 136 and 137: APPENDIX II JOINTLY CONTROLLED ENTI
- Page 138 and 139: Group company Auditor Location Main
- Page 140 and 141: Group company Auditor Location Main
- Page 142 and 143: Company Location Main business line
- Page 144 and 145: APPENDIX V DETAIL OF CONSOLIDATED R
- Page 146 and 147: Translation of a report originally
- Page 148 and 149: % EBITDA Jan-Dec 10 Jan-Dec 11 Ener
- Page 150 and 151: - The volume of business of the Rea
- Page 152 and 153: ACCIONA Energy’s revenue increase
- Page 154 and 155:
Acciona Real Estate (Millions of eu
- Page 156 and 157:
Thanks to the positive performance
- Page 158 and 159:
Investments Net investments in 2011
- Page 160 and 161:
18 April 2011: sale of Chilean conc
- Page 162 and 163:
30 June 2011: ACCIONA submitted the
- Page 164 and 165:
Stock Market Data Share Capital Pri
- Page 166 and 167:
Before a decision is made to invest
- Page 168 and 169:
enhance environmental efficiency. I
- Page 170 and 171:
166 ongoing R&D+i projects were con
- Page 172 and 173:
However, the fall in growth has bee
- Page 174 and 175:
For the purposes of Royal Decree 13