think-cell 5.3 – User Guide
think-cell 5.3 – User Guide
think-cell 5.3 – User Guide

Create successful ePaper yourself
Turn your PDF publications into a flip-book with our unique Google optimized e-Paper software.
<strong>–</strong> You can also select a contiguous range of features<br />
by holding down the ✄ <br />
✂Shift<br />
⇑✁key, moving the mouse<br />
pointer and then clicking with the mouse. Watch how<br />
the affected features highlight while you move the<br />
mouse with the ✄ <br />
✂Shift<br />
⇑✁key held down.<br />
Note: In general, you cannot move or resize features.<br />
Features are part of the smart-element and are automatically<br />
placed in accordance to the smart-element’s<br />
placement. If there are for once multiple possible placements<br />
for a feature, you can drag the feature to specify<br />
its location.<br />
The following screenshot shows how all column segments<br />
of the second data series highlight in orange while<br />
they are collectively selected in a ✄ <br />
✂Shift<br />
⇑-click ✁ operation:<br />
When you select features, a floating toolbar containing<br />
the corresponding property controls will appear. For the<br />
selection of column segments as illustrated above, for<br />
example the Fill Color control becomes available in the<br />
toolbar:<br />
In our example, we want to change the shading of the<br />
second data series, as required by the scribble on page<br />
Introduction to <strong>think</strong>-<strong>cell</strong> 18<br />
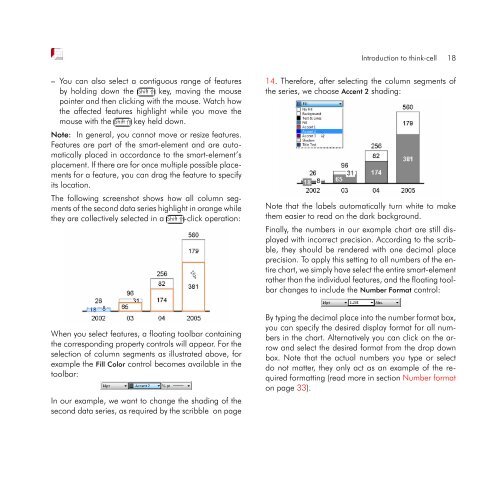
14. Therefore, after selecting the column segments of<br />
the series, we choose Accent 2 shading:<br />
Note that the labels automatically turn white to make<br />
them easier to read on the dark background.<br />
Finally, the numbers in our example chart are still displayed<br />
with incorrect precision. According to the scribble,<br />
they should be rendered with one decimal place<br />
precision. To apply this setting to all numbers of the entire<br />
chart, we simply have select the entire smart-element<br />
rather than the individual features, and the floating toolbar<br />
changes to include the Number Format control:<br />
By typing the decimal place into the number format box,<br />
you can specify the desired display format for all numbers<br />
in the chart. Alternatively you can click on the arrow<br />
and select the desired format from the drop down<br />
box. Note that the actual numbers you type or select<br />
do not matter, they only act as an example of the required<br />
formatting (read more in section Number format<br />
on page 33).