think-cell 5.3 – User Guide
think-cell 5.3 – User Guide
think-cell 5.3 – User Guide

You also want an ePaper? Increase the reach of your titles
YUMPU automatically turns print PDFs into web optimized ePapers that Google loves.
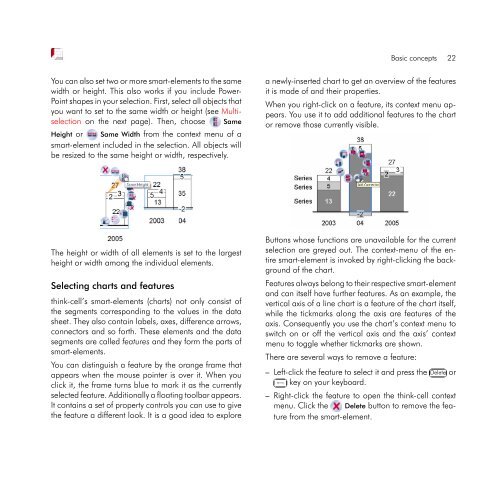
You can also set two or more smart-elements to the same<br />
width or height. This also works if you include Power-<br />
Point shapes in your selection. First, select all objects that<br />
you want to set to the same width or height (see Multiselection<br />
on the next page). Then, choose Same<br />
Height or Same Width from the context menu of a<br />
smart-element included in the selection. All objects will<br />
be resized to the same height or width, respectively.<br />
The height or width of all elements is set to the largest<br />
height or width among the individual elements.<br />
Selecting charts and features<br />
<strong>think</strong>-<strong>cell</strong>’s smart-elements (charts) not only consist of<br />
the segments corresponding to the values in the data<br />
sheet. They also contain labels, axes, difference arrows,<br />
connectors and so forth. These elements and the data<br />
segments are called features and they form the parts of<br />
smart-elements.<br />
You can distinguish a feature by the orange frame that<br />
appears when the mouse pointer is over it. When you<br />
click it, the frame turns blue to mark it as the currently<br />
selected feature. Additionally a floating toolbar appears.<br />
It contains a set of property controls you can use to give<br />
the feature a different look. It is a good idea to explore<br />
Basic concepts 22<br />
a newly-inserted chart to get an overview of the features<br />
it is made of and their properties.<br />
When you right-click on a feature, its context menu appears.<br />
You use it to add additional features to the chart<br />
or remove those currently visible.<br />
Buttons whose functions are unavailable for the current<br />
selection are greyed out. The context-menu of the entire<br />
smart-element is invoked by right-clicking the background<br />
of the chart.<br />
Features always belong to their respective smart-element<br />
and can itself have further features. As an example, the<br />
vertical axis of a line chart is a feature of the chart itself,<br />
while the tickmarks along the axis are features of the<br />
axis. Consequently you use the chart’s context menu to<br />
switch on or off the vertical axis and the axis’ context<br />
menu to toggle whether tickmarks are shown.<br />
There are several ways to remove a feature:<br />
<strong>–</strong> Left-click the feature to select it and press the ✄ <br />
✂Delete✁or<br />
✄ <br />
✂↢<br />
✁key<br />
on your keyboard.<br />
<strong>–</strong> Right-click the feature to open the <strong>think</strong>-<strong>cell</strong> context<br />
menu. Click the Delete button to remove the feature<br />
from the smart-element.