think-cell 5.3 – User Guide
think-cell 5.3 – User Guide
think-cell 5.3 – User Guide

You also want an ePaper? Increase the reach of your titles
YUMPU automatically turns print PDFs into web optimized ePapers that Google loves.
7. Column chart, line chart and area chart<br />
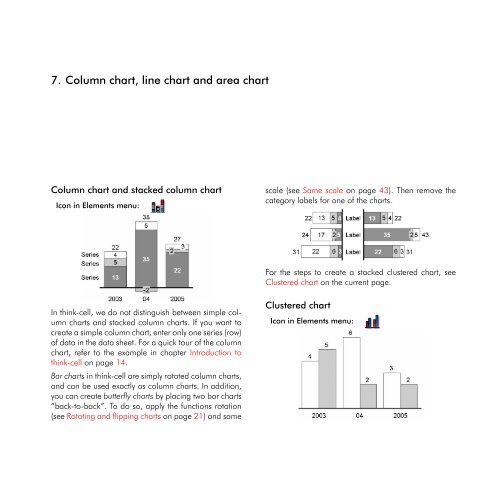
Column chart and stacked column chart<br />
Icon in Elements menu:<br />
In <strong>think</strong>-<strong>cell</strong>, we do not distinguish between simple column<br />
charts and stacked column charts. If you want to<br />
create a simple column chart, enter only one series (row)<br />
of data in the data sheet. For a quick tour of the column<br />
chart, refer to the example in chapter Introduction to<br />
<strong>think</strong>-<strong>cell</strong> on page 14.<br />
Bar charts in <strong>think</strong>-<strong>cell</strong> are simply rotated column charts,<br />
and can be used exactly as column charts. In addition,<br />
you can create butterfly charts by placing two bar charts<br />
“back-to-back”. To do so, apply the functions rotation<br />
(see Rotating and flipping charts on page 21) and same<br />
scale (see Same scale on page 43). Then remove the<br />
category labels for one of the charts.<br />
For the steps to create a stacked clustered chart, see<br />
Clustered chart on the current page.<br />
Clustered chart<br />
Icon in Elements menu: