think-cell 5.3 – User Guide
think-cell 5.3 – User Guide
think-cell 5.3 – User Guide

You also want an ePaper? Increase the reach of your titles
YUMPU automatically turns print PDFs into web optimized ePapers that Google loves.
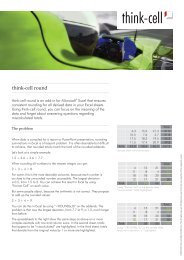
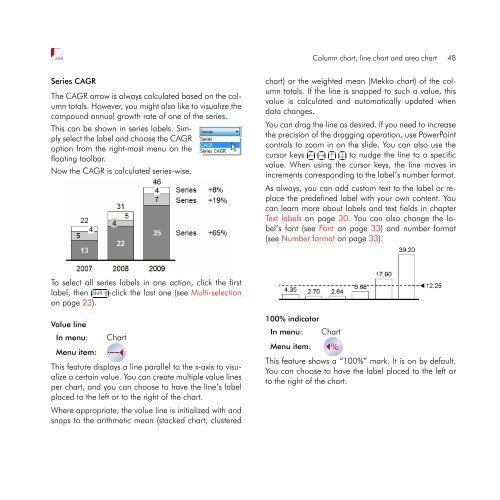
Series CAGR<br />
The CAGR arrow is always calculated based on the column<br />
totals. However, you might also like to visualize the<br />
compound annual growth rate of one of the series.<br />
This can be shown in series labels. Simply<br />
select the label and choose the CAGR<br />
option from the right-most menu on the<br />
floating toolbar.<br />
Now the CAGR is calculated series-wise.<br />
To select all series labels in one action, click the first<br />
label, then ✄ <br />
✂Shift<br />
⇑-click ✁ the last one (see Multi-selection<br />
on page 23).<br />
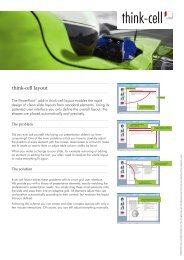
Value line<br />
In menu: Chart<br />
Menu item:<br />
This feature displays a line parallel to the x-axis to visualize<br />
a certain value. You can create multiple value lines<br />
per chart, and you can choose to have the line’s label<br />
placed to the left or to the right of the chart.<br />
Where appropriate, the value line is initialized with and<br />
snaps to the arithmetic mean (stacked chart, clustered<br />
Column chart, line chart and area chart 48<br />
chart) or the weighted mean (Mekko chart) of the column<br />
totals. If the line is snapped to such a value, this<br />
value is calculated and automatically updated when<br />
data changes.<br />
You can drag the line as desired. If you need to increase<br />
the precision of the dragging operation, use PowerPoint<br />
controls to zoom in on the slide. You can also use the<br />
cursor keys ✄ ✂ ✁ ← ✄ ✂ ✁ → ✄ ✂ ↑ ✁<br />
✄ ✂ ↓ ✁to<br />
nudge the line to a specific<br />
value. When using the cursor keys, the line moves in<br />
increments corresponding to the label’s number format.<br />
As always, you can add custom text to the label or replace<br />
the predefined label with your own content. You<br />
can learn more about labels and text fields in chapter<br />
Text labels on page 30. You can also change the label’s<br />
font (see Font on page 33) and number format<br />
(see Number format on page 33).<br />
100% indicator<br />
In menu: Chart<br />
Menu item:<br />
This feature shows a “100%” mark. It is on by default.<br />
You can choose to have the label placed to the left or<br />
to the right of the chart.