think-cell 5.3 – User Guide
think-cell 5.3 – User Guide
think-cell 5.3 – User Guide

Create successful ePaper yourself
Turn your PDF publications into a flip-book with our unique Google optimized e-Paper software.
either by the user or by a same scale operation (see<br />
Same scale on the next page).<br />
Add Break Add a break at the current mouse pointer<br />
position (see Value axis break on this page).<br />
Set Crosses At/Between Categories Alter the<br />
crossing behavior for a line chart.<br />
Value axis break<br />
In menu: Segment, axis, line, area<br />
Menu item:<br />
Use a value axis break to shrink a particularly large segment<br />
and enhance readability for the smaller segments.<br />
To add a value axis break, click the part of the segment<br />
or axis where you want the break to go and open<br />
the context menu. When adding a value axis break, the<br />
exact position where you right-click a segment or axis<br />
makes a difference.<br />
Any break you insert applies to the value axis (if shown)<br />
and to all segments sharing the same range of the axis.<br />
For this reason, you can not add a break to the axis<br />
at any position where there is a segment border in any<br />
of the chart’s columns. A break can only be added if<br />
at the mouse pointer location there is some part of the<br />
value axis big enough to display at least the two lines<br />
that visualize the break.<br />
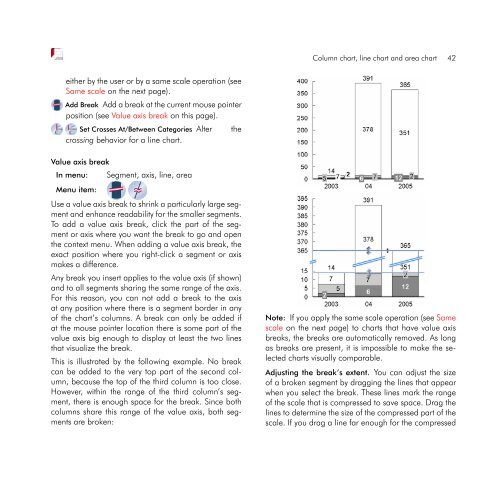
This is illustrated by the following example. No break<br />
can be added to the very top part of the second column,<br />
because the top of the third column is too close.<br />
However, within the range of the third column’s segment,<br />
there is enough space for the break. Since both<br />
columns share this range of the value axis, both segments<br />
are broken:<br />
Column chart, line chart and area chart 42<br />
Note: If you apply the same scale operation (see Same<br />
scale on the next page) to charts that have value axis<br />
breaks, the breaks are automatically removed. As long<br />
as breaks are present, it is impossible to make the selected<br />
charts visually comparable.<br />
Adjusting the break’s extent. You can adjust the size<br />
of a broken segment by dragging the lines that appear<br />
when you select the break. These lines mark the range<br />
of the scale that is compressed to save space. Drag the<br />
lines to determine the size of the compressed part of the<br />
scale. If you drag a line far enough for the compressed