EuroSDR Projects - Host Ireland
EuroSDR Projects - Host Ireland
EuroSDR Projects - Host Ireland
You also want an ePaper? Increase the reach of your titles
YUMPU automatically turns print PDFs into web optimized ePapers that Google loves.
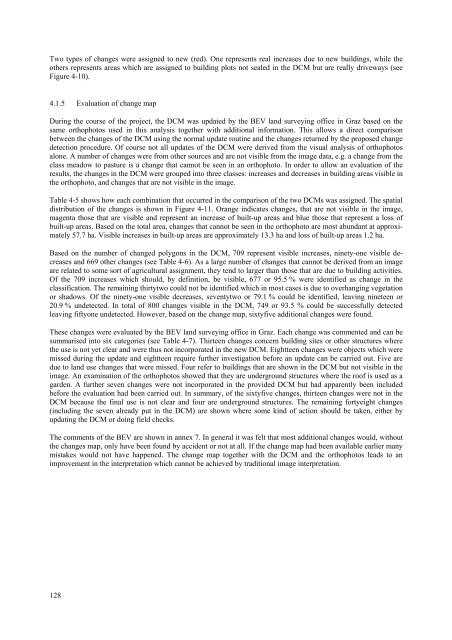
Two types of changes were assigned to new (red). One represents real increases due to new buildings, while the<br />
others represents areas which are assigned to building plots not sealed in the DCM but are really driveways (see<br />
Figure 4-10).<br />
4.1.5 Evaluation of change map<br />
During the course of the project, the DCM was updated by the BEV land surveying office in Graz based on the<br />
same orthophotos used in this analysis together with additional information. This allows a direct comparison<br />
between the changes of the DCM using the normal update routine and the changes returned by the proposed change<br />
detection procedure. Of course not all updates of the DCM were derived from the visual analysis of orthophotos<br />
alone. A number of changes were from other sources and are not visible from the image data, e.g. a change from the<br />
class meadow to pasture is a change that cannot be seen in an orthophoto. In order to allow an evaluation of the<br />
results, the changes in the DCM were grouped into three classes: increases and decreases in building areas visible in<br />
the orthophoto, and changes that are not visible in the image.<br />
Table 4-5 shows how each combination that occurred in the comparison of the two DCMs was assigned. The spatial<br />
distribution of the changes is shown in Figure 4-11. Orange indicates changes, that are not visible in the image,<br />
magenta those that are visible and represent an increase of built-up areas and blue those that represent a loss of<br />
built-up areas. Based on the total area, changes that cannot be seen in the orthophoto are most abundant at approximately<br />
57.7 ha. Visible increases in built-up areas are approximately 13.3 ha and loss of built-up areas 1.2 ha.<br />
Based on the number of changed polygons in the DCM, 709 represent visible increases, ninety-one visible decreases<br />
and 669 other changes (see Table 4-6). As a large number of changes that cannot be derived from an image<br />
are related to some sort of agricultural assignment, they tend to larger than those that are due to building activities.<br />
Of the 709 increases which should, by definition, be visible, 677 or 95.5 % were identified as change in the<br />
classification. The remaining thirtytwo could not be identified which in most cases is due to overhanging vegetation<br />
or shadows. Of the ninety-one visible decreases, seventytwo or 79.1 % could be identified, leaving nineteen or<br />
20.9 % undetected. In total of 800 changes visible in the DCM, 749 or 93.5 % could be successfully detected<br />
leaving fiftyone undetected. However, based on the change map, sixtyfive additional changes were found.<br />
These changes were evaluated by the BEV land surveying office in Graz. Each change was commented and can be<br />
summarised into six categories (see Table 4-7). Thirteen changes concern building sites or other structures where<br />
the use is not yet clear and were thus not incorporated in the new DCM. Eightteen changes were objects which were<br />
missed during the update and eightteen require further investigation before an update can be carried out. Five are<br />
due to land use changes that were missed. Four refer to buildings that are shown in the DCM but not visible in the<br />
image. An examination of the orthophotos showed that they are underground structures where the roof is used as a<br />
garden. A further seven changes were not incorporated in the provided DCM but had apparently been included<br />
before the evaluation had been carried out. In summary, of the sixtyfive changes, thirteen changes were not in the<br />
DCM because the final use is not clear and four are underground structures. The remaining fortyeight changes<br />
(including the seven already put in the DCM) are shown where some kind of action should be taken, either by<br />
updating the DCM or doing field checks.<br />
The comments of the BEV are shown in annex 7. In general it was felt that most additional changes would, without<br />
the changes map, only have been found by accident or not at all. If the change map had been available earlier many<br />
mistakes would not have happened. The change map together with the DCM and the orthophotos leads to an<br />
improvement in the interpretation which cannot be achieved by traditional image interpretation.<br />
128


