EuroSDR Projects - Host Ireland
EuroSDR Projects - Host Ireland
EuroSDR Projects - Host Ireland

You also want an ePaper? Increase the reach of your titles
YUMPU automatically turns print PDFs into web optimized ePapers that Google loves.
170<br />
Red roof Bright object<br />
0 20 40 Meters<br />
Forest Grey object<br />
Meadow Other urban object<br />
Field Shadow<br />
Figure 2. Corrected classification of subset<br />
The next step is the comparison with the reference data<br />
to highlight where changes have taken place. Fig. 3<br />
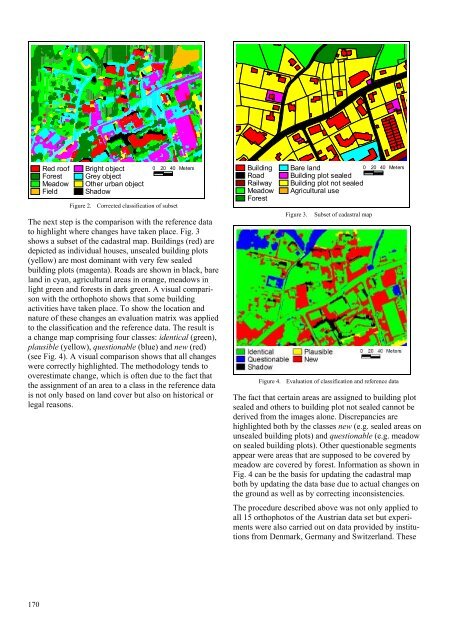
shows a subset of the cadastral map. Buildings (red) are<br />
depicted as individual houses, unsealed building plots<br />
(yellow) are most dominant with very few sealed<br />
building plots (magenta). Roads are shown in black, bare<br />
land in cyan, agricultural areas in orange, meadows in<br />
light green and forests in dark green. A visual comparison<br />
with the orthophoto shows that some building<br />
activities have taken place. To show the location and<br />
nature of these changes an evaluation matrix was applied<br />
to the classification and the reference data. The result is<br />
a change map comprising four classes: identical (green),<br />
plausible (yellow), questionable (blue) and new (red)<br />
(see Fig. 4). A visual comparison shows that all changes<br />
were correctly highlighted. The methodology tends to<br />
overestimate change, which is often due to the fact that<br />
the assignment of an area to a class in the reference data<br />
is not only based on land cover but also on historical or<br />
legal reasons.<br />
Building<br />
Road<br />
Railway<br />
Meadow<br />
Forest<br />
Bare land<br />
Building plot sealed<br />
Building plot not sealed<br />
Agricultural use<br />
Figure 3. Subset of cadastral map<br />
0 20 40 Meters<br />
Figure 4. Evaluation of classification and reference data<br />
The fact that certain areas are assigned to building plot<br />
sealed and others to building plot not sealed cannot be<br />
derived from the images alone. Discrepancies are<br />
highlighted both by the classes new (e.g. sealed areas on<br />
unsealed building plots) and questionable (e.g. meadow<br />
on sealed building plots). Other questionable segments<br />
appear were areas that are supposed to be covered by<br />
meadow are covered by forest. Information as shown in<br />
Fig. 4 can be the basis for updating the cadastral map<br />
both by updating the data base due to actual changes on<br />
the ground as well as by correcting inconsistencies.<br />
The procedure described above was not only applied to<br />
all 15 orthophotos of the Austrian data set but experiments<br />
were also carried out on data provided by institutions<br />
from Denmark, Germany and Switzerland. These