EuroSDR Projects - Host Ireland
EuroSDR Projects - Host Ireland
EuroSDR Projects - Host Ireland

Create successful ePaper yourself
Turn your PDF publications into a flip-book with our unique Google optimized e-Paper software.
In building length determination (Figure 4-14), laser based methods were not as accurate as<br />
photogrammetric methods, as could be expected from the above. The photogrammetrically derived<br />
lengths varied from 14 to 51 cm (RMSE, mean 26 cm, median 22 cm, std 12.6 cm). Lengths obtained<br />
with aerial image assisted laser scanning varied from 19 to 108 cm (mean 59.4 cm, median 57 cm, std<br />
31.2 cm). The laser scanning based lengths varied from 13 to 292 cm (mean 93 cm, median 84.5 cm,<br />
std 60.9 cm). With laser scanning the complexity of the buildings was the major cause for site wise<br />
variation rather than the point density.<br />
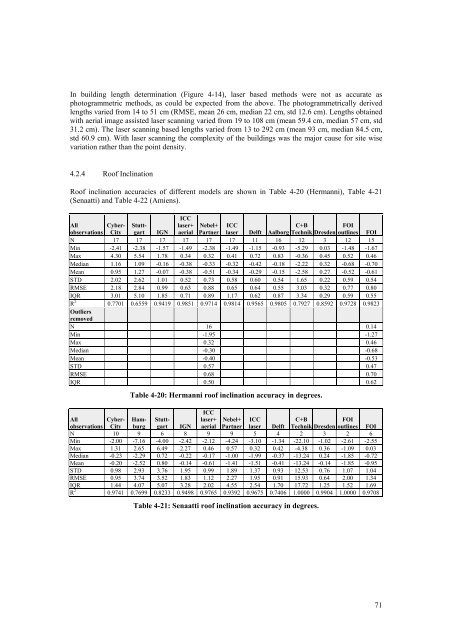
4.2.4 Roof Inclination<br />
Roof inclination accuracies of different models are shown in Table 4-20 (Hermanni), Table 4-21<br />
(Senaatti) and Table 4-22 (Amiens).<br />
All Cyber- Stutt-<br />
ICC<br />
laser+ Nebel+ ICC<br />
C+B<br />
FOI<br />
observations City gart IGN aerial Partner laser Delft Aalborg Technik Dresden outlines FOI<br />
N 17 17 17 17 17 17 11 16 12 3 12 15<br />
Min -2.41 -2.38 -1.57 -1.49 -2.38 -1.49 -1.15 -0.93 -5.29 0.03 -1.48 -1.67<br />
Max 4.30 5.54 1.78 0.34 0.32 0.41 0.72 0.83 -0.36 0.45 0.52 0.46<br />
Median 1.16 1.09 -0.16 -0.38 -0.33 -0.32 -0.42 -0.18 -2.22 0.32 -0.68 -0.70<br />
Mean 0.95 1.27 -0.07 -0.38 -0.51 -0.34 -0.29 -0.15 -2.58 0.27 -0.52 -0.61<br />
STD 2.02 2.62 1.01 0.52 0.73 0.58 0.60 0.54 1.65 0.22 0.59 0.54<br />
RMSE 2.18 2.84 0.99 0.63 0.88 0.65 0.64 0.55 3.03 0.32 0.77 0.80<br />
IQR 3.01 5.10 1.85 0.71 0.89 1.17 0.62 0.87 3.34 0.29 0.59 0.55<br />
R 2 Outliers<br />
removed<br />
0.7701 0.6559 0.9419 0.9851 0.9714 0.9814 0.9565 0.9805 0.7927 0.8592 0.9728 0.9823<br />
N 16 0.14<br />
Min -1.95 -1.27<br />
Max 0.32 0.46<br />
Median -0.30 -0.68<br />
Mean -0.40 -0.53<br />
STD 0.57 0.47<br />
RMSE 0.68 0.70<br />
IQR 0.50 0.62<br />
Table 4-20: Hermanni roof inclination accuracy in degrees.<br />
All Cyber- HamStutt- ICC<br />
laser+ Nebel+ ICC<br />
C+B<br />
FOI<br />
observations City burggart IGN aerial Partner laser Delft Technik Dresden outlines FOI<br />
N 10 9 6 8 9 9 5 4 2 3 2 6<br />
Min -2.00 -7.16 -4.00 -2.42 -2.12 -4.24 -3.10 -1.34 -22.10 -1.02 -2.61 -2.55<br />
Max 1.31 2.65 6.49 2.27 0.46 0.57 0.32 0.42 -4.38 0.36 -1.09 0.03<br />
Median -0.23 -2.29 0.72 -0.22 -0.17 -1.00 -1.99 -0.37 -13.24 0.24 -1.85 -0.72<br />
Mean -0.20 -2.52 0.80 -0.14 -0.61 -1.41 -1.51 -0.41 -13.24 -0.14 -1.85 -0.95<br />
STD 0.98 2.93 3.76 1.95 0.99 1.89 1.37 0.93 12.53 0.76 1.07 1.04<br />
RMSE 0.95 3.74 3.52 1.83 1.12 2.27 1.95 0.91 15.93 0.64 2.00 1.34<br />
IQR 1.44 4.07 5.07 3.28 2.02 4.55 2.54 1.70 17.72 1.25 1.52 1.69<br />
R 2 0.9741 0.7699 0.8233 0.9498 0.9765 0.9392 0.9675 0.7406 1.0000 0.9904 1.0000 0.9708<br />
Table 4-21: Senaatti roof inclination accuracy in degrees.<br />
71