EuroSDR Projects - Host Ireland
EuroSDR Projects - Host Ireland
EuroSDR Projects - Host Ireland

You also want an ePaper? Increase the reach of your titles
YUMPU automatically turns print PDFs into web optimized ePapers that Google loves.
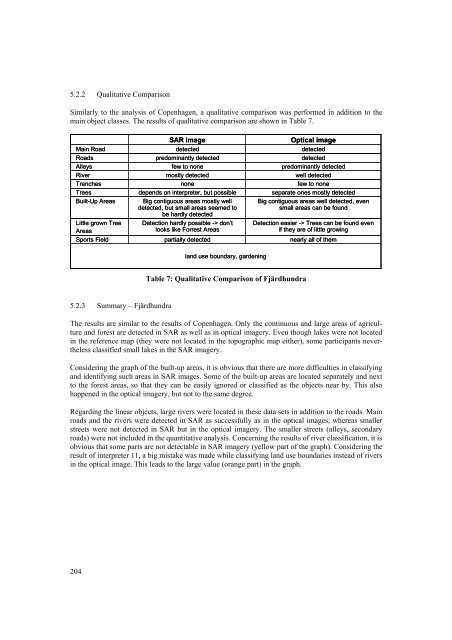
5.2.2 Qualitative Comparison<br />
Similarly to the analysis of Copenhagen, a qualitative comparison was performed in addition to the<br />
main object classes. The results of qualitative comparison are shown in Table 7.<br />
Main Road<br />
Roads<br />
Alleys<br />
River<br />
Trenches<br />
Trees<br />
Built-Up Areas<br />
Little grown Tree<br />
Areas<br />
Sports Field<br />
5.2.3 Summary – Fjärdhundra<br />
204<br />
SAR image<br />
detected<br />
predominantly detected<br />
few to none<br />
mostly detected<br />
none<br />
depends on interpreter, but possible<br />
Big contiguous areas mostly well<br />
detected, but small areas seemed to<br />
be hardly detected<br />
Detection hardly possible -> don’t<br />
looks like Forrest Areas<br />
partially detected<br />
land use boundary, gardening<br />
Table 7: Qualitative Comparison of Fjärdhundra<br />
Optical image<br />
detected<br />
detected<br />
predominantly detected<br />
well detected<br />
few to none<br />
separate ones mostly detected<br />
Big contiguous areas well detected, even<br />
small areas can be found<br />
Detection easier -> Trees can be found even<br />
if they are of little growing<br />
nearly all of them<br />
The results are similar to the results of Copenhagen. Only the continuous and large areas of agriculture<br />
and forest are detected in SAR as well as in optical imagery. Even though lakes were not located<br />
in the reference map (they were not located in the topographic map either), some participants nevertheless<br />
classified small lakes in the SAR imagery.<br />
Considering the graph of the built-up areas, it is obvious that there are more difficulties in classifying<br />
and identifying such areas in SAR images. Some of the built-up areas are located separately and next<br />
to the forest areas, so that they can be easily ignored or classified as the objects near by. This also<br />
happened in the optical imagery, but not to the same degree.<br />
Regarding the linear objects, large rivers were located in these data sets in addition to the roads. Main<br />
roads and the rivers were detected in SAR as successfully as in the optical images, whereas smaller<br />
streets were not detected in SAR but in the optical imagery. The smaller streets (alleys, secondary<br />
roads) were not included in the quantitative analysis. Concerning the results of river classification, it is<br />
obvious that some parts are not detectable in SAR imagery (yellow part of the graph). Considering the<br />
result of interpreter 11, a big mistake was made while classifying land use boundaries instead of rivers<br />
in the optical image. This leads to the large value (orange part) in the graph.