EuroSDR Projects - Host Ireland
EuroSDR Projects - Host Ireland
EuroSDR Projects - Host Ireland

Create successful ePaper yourself
Turn your PDF publications into a flip-book with our unique Google optimized e-Paper software.
2 Test Sites and Test Data<br />
The test sites investigated in the contest were selected to be neither too complex nor to contain overly<br />
simplistic structures. For example, very densely built-up urban regions are hardly to be found. They<br />
certainly would have posed a particularly difficult challenge for SAR imaging, which is why it seemed<br />
to be appropriate not to investigate them intensively. Therefore, selected test areas include agricultural<br />
and forested rural regions as well as industrial and urban areas. Four different test sites with different<br />
contents were selected for the contest. The test areas were located in<br />
• Germany – Trudering: Area around the new fair in Munich - industrial and rural regions<br />
• Germany – Oberpfaffenhofen: Campus and runway of DLR - agricultural and airport regions<br />
• Denmark – Copenhagen: City of Copenhagen - residential and industrial areas<br />
• Sweden – Fjärdhundra - rural area, forested and agricultural regions<br />
2.1 Specification of the Test Data<br />
The data used in the contest consisted of optical color as well as black and white photography of<br />
photogrammetric quality and state-of-the-art airborne SAR with multiple polarizations and different<br />
wavelengths. To meet the objectives only single-pass SAR data is used. In order to account for the<br />
large variety of modern SAR systems, different frequencies as well as polarimetric data were selected.<br />
Certainly, there are even more parameters strongly influencing the appearance of topographic objects<br />
in SAR imagery – such as incidence angle and direction. In spite of their importance regarding object<br />
appearance, these parameters could not be considered, as the high demands of the contest regarding<br />
resolution, and other more practical matters, such as data costs and copyright, already impose restrictive<br />
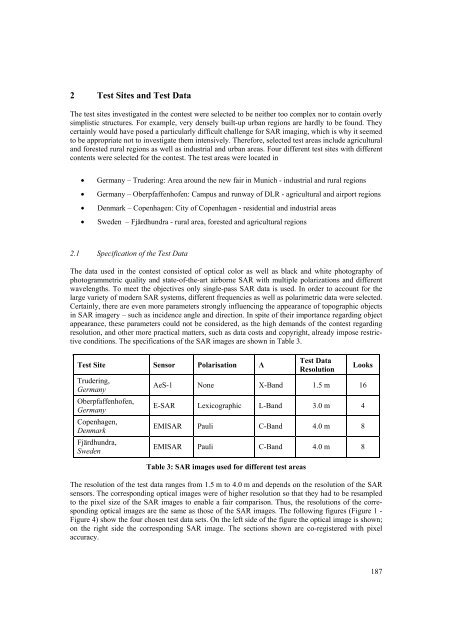
conditions. The specifications of the SAR images are shown in Table 3.<br />
Test Site Sensor Polarisation <br />
Trudering,<br />
Germany<br />
Oberpfaffenhofen,<br />
Germany<br />
Copenhagen,<br />
Denmark<br />
Fjärdhundra,<br />
Sweden<br />
Test Data<br />
Resolution<br />
Looks<br />
AeS-1 None X-Band 1.5 m 16<br />
E-SAR Lexicographic L-Band 3.0 m 4<br />
EMISAR Pauli C-Band 4.0 m 8<br />
EMISAR Pauli C-Band 4.0 m 8<br />
Table 3: SAR images used for different test areas<br />
The resolution of the test data ranges from 1.5 m to 4.0 m and depends on the resolution of the SAR<br />
sensors. The corresponding optical images were of higher resolution so that they had to be resampled<br />
to the pixel size of the SAR images to enable a fair comparison. Thus, the resolutions of the corresponding<br />
optical images are the same as those of the SAR images. The following figures (Figure 1 -<br />
Figure 4) show the four chosen test data sets. On the left side of the figure the optical image is shown;<br />
on the right side the corresponding SAR image. The sections shown are co-registered with pixel<br />
accuracy.<br />
187