- Page 3:
POLYCYCLIC AROMATIC HYDROCARBONS IN
- Page 6 and 7:
composition. Portions ofthe lake th
- Page 8 and 9:
TABLE OF CONTENTS . ABSTRAcr._._ _
- Page 10:
6. CONCLUSIONS_._ _....._._._ _ ._
- Page 13 and 14:
FIGURE 3.104 CONfIGURATION OF ISOCH
- Page 15 and 16:
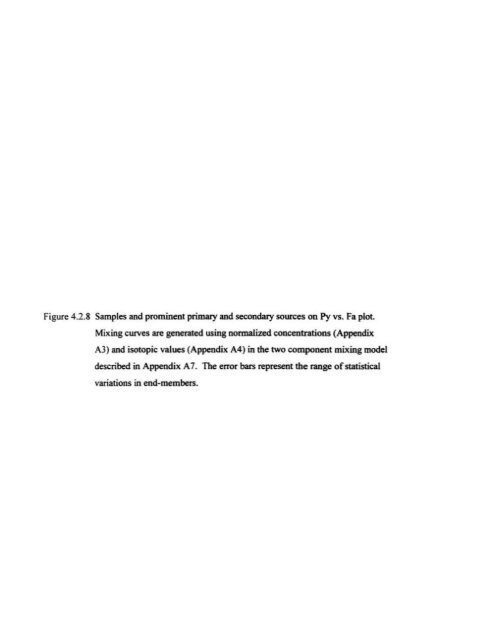
FIGURE 4 .2.12 SAMPLES AND PROMINEN
- Page 17 and 18:
fIGURE 5.3.1 DESCR1Pl1VE MODEL OF S
- Page 19 and 20:
APPENDIX B 3 _ T HEoerwt Of A PtUNC
- Page 21 and 22:
Ip » Ideno(l,2.3 cd)pyrene NIST =
- Page 23:
Figure L 1.1 The 16 parental polycy
- Page 26 and 27:
After release by the primary source
- Page 28:
decomposition processes (O'Malley e
- Page 32:
Figure 2.1.1 The Great Lakes draina
- Page 35 and 36:
;: Duluth Chicago 1 J Lake Superior
- Page 38 and 39:
are the Black River, the Cuyaho ga
- Page 41:
Figure 1.1.5 The pattern of permane
- Page 45 and 46:
sedimentary basins, Western. Centra
- Page 48:
Figure 2. 1.8 Summer (July) air and
- Page 52:
Natural Resources: The lower Great
- Page 57 and 58:
American waters under the current U
- Page 60 and 61:
continuously overflowed com bined s
- Page 63 and 64:
3.1 EXPERIMENTAL 3. METHODS 3.1.1 S
- Page 66 and 67:
Table 3,1.1 Locations and types ofs
- Page 68:
Figure 3.12 Extraction and purifica
- Page 72 and 73:
hexane. 2) the unsaturated aliphati
- Page 75:
this problem. Ratios ofthe two stab
- Page 78:
Figure 3. 1.4 Configuration ofIsoch
- Page 82 and 83:
3.2.1 UNl- AND BIVAJUATE METHODS Th
- Page 84:
f igure 3.2. 1 Mean and range (± s
- Page 87 and 88:
utilized the same instrument (Isoch
- Page 90 and 91:
Selecting lIt1J'iahlu: It was demon
- Page 92 and 93:
w- _ 71
- Page 95 and 96: seven variables with fewer missing
- Page 97 and 98: analysis also employed a greate r n
- Page 99: description. The second cluster ana
- Page 104 and 105: elationships between different site
- Page 107: Figure 4.1.3 Regression ofthree fir
- Page 112: Figure 4.[.5 Isotopic composition (
- Page 116: Figure 4.1.6 Weights ofvariables (c
- Page 120: Figure 4.1.8 Distri bution ofsample
- Page 123 and 124: those at the majority ofstations. S
- Page 126 and 127: Ion, 969, 971, 357, 358). In additi
- Page 129: Figure 4.2.3 Samples and prominent
- Page 132 and 133: analysis supported some ofthc previ
- Page 135 and 136: , ", Is , , >\ ryr " II ,- - , I ,
- Page 137 and 138: 11'
- Page 139: sources (Fi g. 4.2 .5c). This compo
- Page 143: Figure 4.2.7 The relative contribut
- Page 149: Figure 42.9 Samples and promin ent
- Page 153: Figure 4.2.11 Samples and prominent
- Page 157: Figure 4.2. 13 Samples and prominen
- Page 161: Figure 4.2.15 Samples and prominent
- Page 165: Figure 4.2.17 Samples and prominent
- Page 168 and 169: It is difficult to differentiate be
- Page 170 and 171: Figure 4.2.18 Weights ofvariables (
- Page 172: Figure 42.19 Distribution ofsamples
- Page 175 and 176: 5.1 SPATIAL DI STRIBUTION s. DISCUS
- Page 177: f igure 5.1.1 Zones coinciding with
- Page 180: f igure 5. 1.2 Average and range (
- Page 184: Figure 5.1.4 Zones (clusters) in th
- Page 187: Figure 5.1.5 Direction ofthe mean s
- Page 191 and 192: The location ofthe third station at
- Page 193: Figure 5.1.7 Station locations and
- Page 197:
Figure 5.1.8 Station locations and
- Page 201 and 202:
5.1.4 and Section 4.1.2). This clus
- Page 204:
Figure 5.1.1 1 Statioo locations an
- Page 208 and 209:
unaffected by the contaminated flow
- Page 211 and 212:
this station is die clo$esf to the
- Page 213 and 214:
samples and sources (Fig. 52.1 and
- Page 216 and 217:
There is yet another observation po
- Page 218 and 219:
with the relative contribution ofdi
- Page 221 and 222:
Table S.l.1 Six dusters identified
- Page 224 and 225:
the three previous ly identified zo
- Page 226:
Figure 5.2.4 Station locations and
- Page 229 and 230:
contribution from petroleum related
- Page 231 and 232:
(Fig. 4.2.7). Finally. this site co
- Page 233 and 234:
Snow melt and sewer releases seem t
- Page 235 and 236:
importance ofcombustion-derived PAR
- Page 237 and 238:
Intens ity o(degradation (the South
- Page 239 and 240:
where this importance is somewhat r
- Page 241:
Figure 5.2.5 Station tocatices andz
- Page 244 and 245:
:2 for molecular composition assume
- Page 247 and 248:
ange of Slatistica1 variat ion of t
- Page 249:
Figure 5.].1 Descriptive model ofso
- Page 252 and 253:
conveyed into the river through dir
- Page 254 and 255:
molecular composition. Its applicat
- Page 256 and 257:
Canton L. and Grimal t 1. O. (1992)
- Page 258 and 259:
Howell E. T., Marvin C. H., Bilyea
- Page 260 and 261:
Olson F. C. W. (l950) The currents
- Page 263 and 264:
Willett P. (1981) Similarity and cl
- Page 266:
t Apprndb AI. [cout.) bl S,.lioD A<
- Page 271 and 272:
Appendill A6. The two-component mas
- Page 273:
Appendix A7. (cont.) Xl. = X llVt r
- Page 277:
• ass
- Page 281:
Appendix 82. (cont.)
- Page 285:
Appendix IU. (cant.) oj Tue Dec 24
- Page 290:
AppendiI C3. (cont.) Coo c.eo lrati