Detroit Lions vs atLanta faLcons JOHNSON'S Mega-PURSUIT 2012 ...
Detroit Lions vs atLanta faLcons JOHNSON'S Mega-PURSUIT 2012 ...
Detroit Lions vs atLanta faLcons JOHNSON'S Mega-PURSUIT 2012 ...

You also want an ePaper? Increase the reach of your titles
YUMPU automatically turns print PDFs into web optimized ePapers that Google loves.
meDia information<br />
<strong>Detroit</strong>lions.com -- Media.<strong>Detroit</strong>lions.com<br />
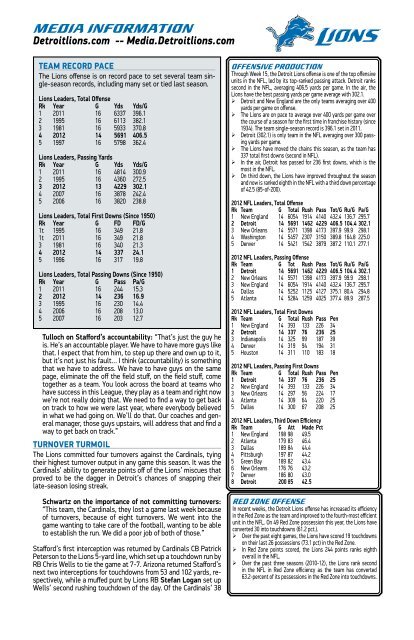
TeaM RecORd Pace<br />
The <strong>Lions</strong> offense is on record pace to set several team single-season<br />
records, including many set or tied last season.<br />
<strong>Lions</strong> Leaders, Total Offense<br />
Rk Year G Yds Yds/G<br />
1 2011 16 6337 396.1<br />
2 1995 16 6113 382.1<br />
3 1981 16 5933 370.8<br />
4 <strong>2012</strong> 14 5691 406.5<br />
5 1997 16 5798 362.4<br />
<strong>Lions</strong> Leaders, Passing Yards<br />
Rk Year G Yds Yds/G<br />
1 2011 16 4814 300.9<br />
2 1995 16 4360 272.5<br />
3 <strong>2012</strong> 13 4229 302.1<br />
4 2007 16 3878 242.4<br />
5 2006 16 3820 238.8<br />
<strong>Lions</strong> Leaders, Total First Downs (Since 1950)<br />
Rk Year G FD FD/G<br />
1t 1995 16 349 21.8<br />
1t 2011 16 349 21.8<br />
3 1981 16 340 21.3<br />
4 <strong>2012</strong> 14 337 24.1<br />
5 1996 16 317 19.8<br />
<strong>Lions</strong> Leaders, Total Passing Downs (Since 1950)<br />
Rk Year G Pass Pa/G<br />
1 2011 16 244 15.3<br />
2 <strong>2012</strong> 14 236 16.9<br />
3 1995 16 230 14.4<br />
4 2006 16 208 13.0<br />
5 2007 16 203 12.7<br />
Tulloch on Stafford’s accountability: “That’s just the guy he<br />
is. He’s an accountable player. We have to have more guys like<br />
that. I expect that from him, to step up there and own up to it,<br />
but it’s not just his fault… I think (accountability) is something<br />
that we have to address. We have to have guys on the same<br />
page, eliminate the off the field stuff, on the field stuff, come<br />
together as a team. You look across the board at teams who<br />
have success in this League, they play as a team and right now<br />
we’re not really doing that. We need to find a way to get back<br />
on track to how we were last year, where everybody believed<br />
in what we had going on. We’ll do that. Our coaches and general<br />
manager, those guys upstairs, will address that and find a<br />
way to get back on track.”<br />
TURNOVeR TURMOIL<br />
The <strong>Lions</strong> committed four turnovers against the Cardinals, tying<br />
their highest turnover output in any game this season. It was the<br />
Cardinals’ ability to generate points off of the <strong>Lions</strong>’ miscues that<br />
proved to be the dagger in <strong>Detroit</strong>’s chances of snapping their<br />
late-season losing streak.<br />
Schwartz on the importance of not committing turnovers:<br />
“This team, the Cardinals, they lost a game last week because<br />
of turnovers, because of eight turnovers. We went into the<br />
game wanting to take care of the football, wanting to be able<br />
to establish the run. We did a poor job of both of those.”<br />
Stafford’s first interception was returned by Cardinals CB Patrick<br />
Peterson to the <strong>Lions</strong> 5-yard line, which set up a touchdown run by<br />
RB Chris Wells to tie the game at 7-7. Arizona returned Stafford’s<br />
next two interceptions for touchdowns from 53 and 102 yards, respectively,<br />
while a muffed punt by <strong>Lions</strong> RB Stefan Logan set up<br />
Wells’ second rushing touchdown of the day. Of the Cardinals’ 38<br />
offensive ProDUction<br />
Through Week 15, the <strong>Detroit</strong> <strong>Lions</strong> offense is one of the top offensive<br />
units in the NFL, led by its top-ranked passing attack. <strong>Detroit</strong> ranks<br />
second in the NFL, averaging 406.5 yards per game. In the air, the<br />
<strong>Lions</strong> have the best passing yards per game average with 302.1.<br />
¾ <strong>Detroit</strong> and New England are the only teams averaging over 400<br />
yards per game on offense.<br />
¾ The <strong>Lions</strong> are on pace to average over 400 yards per game over<br />
the course of a season for the first time in franchise history (since<br />
1934). The team single-season record is 396.1 set in 2011.<br />
¾ <strong>Detroit</strong> (302.1) is only team in the NFL averaging over 300 passing<br />
yards per game.<br />
¾ The <strong>Lions</strong> have moved the chains this season, as the team has<br />
337 total first downs (second in NFL).<br />
¾ In the air, <strong>Detroit</strong> has passed for 236 first downs, which is the<br />
most in the NFL.<br />
¾ On third down, the <strong>Lions</strong> have improved throughout the season<br />
and now is ranked eighth in the NFL with a third down percentage<br />
of 42.5 (85-of-200).<br />
<strong>2012</strong> NFL Leaders, Total Offense<br />
Rk Team G Total Rush Pass Tot/G Ru/G Pa/G<br />
1 New England 14 6054 1914 4140 432.4 136.7 295.7<br />
2 <strong>Detroit</strong> 14 5691 1462 4229 406.5 104.4 302.1<br />
3 New Orleans 14 5571 1398 4173 397.9 99.9 298.1<br />
4 Washington 14 5457 2307 3150 389.8 164.8 225.0<br />
5 Denver 14 5421 1542 3879 387.2 110.1 277.1<br />
<strong>2012</strong> NFL Leaders, Passing Offense<br />
Rk Team G Tot Rush Pass Tot/G Ru/G Pa/G<br />
1 <strong>Detroit</strong> 14 5691 1462 4229 406.5 104.4 302.1<br />
2 New Orleans 14 5571 1398 4173 397.9 99.9 298.1<br />
3 New England 14 6054 1914 4140 432.4 136.7 295.7<br />
4 Dallas 14 5252 1125 4127 375.1 80.4 294.8<br />
5 Atlanta 14 5284 1259 4025 377.4 89.9 287.5<br />
<strong>2012</strong> NFL Leaders, Total First Downs<br />
Rk Team G Total Rush Pass Pen<br />
1 New England 14 393 133 226 34<br />
2 <strong>Detroit</strong> 14 337 76 236 25<br />
3 Indianapolis 14 325 99 187 39<br />
4 Denver 14 319 94 194 31<br />
5 Houston 14 311 110 183 18<br />
<strong>2012</strong> NFL Leaders, Passing First Downs<br />
Rk Team G Total Rush Pass Pen<br />
1 <strong>Detroit</strong> 14 337 76 236 25<br />
2 New England 14 393 133 226 34<br />
3 New Orleans 14 297 56 224 17<br />
4 Atlanta 14 309 64 220 25<br />
5 Dallas 14 300 67 208 25<br />
<strong>2012</strong> NFL Leaders, Third Down Efficiency<br />
Rk Team G Att Made Pct<br />
1 New England 198 98 49.5<br />
2 Atlanta 179 83 46.4<br />
3 Dallas 189 84 44.4<br />
4 Pittsburgh 197 87 44.2<br />
5 Green Bay 189 82 43.4<br />
6 New Orleans 176 76 43.2<br />
7 Denver 186 80 43.0<br />
8 <strong>Detroit</strong> 200 85 42.5<br />
reD Zone offense<br />
In recent weeks, the <strong>Detroit</strong> <strong>Lions</strong> offense has increased its efficiency<br />
in the Red Zone as the team and improved to the fourth-most efficient<br />
unit in the NFL. On 49 Red Zone possession this year, the <strong>Lions</strong> have<br />
converted 30 into touchdowns (61.2 pct.).<br />
¾ Over the past eight games, the <strong>Lions</strong> have scored 19 touchdowns<br />
on their last 26 possessions (73.1 pct) in the Red Zone.<br />
¾ In Red Zone points scored, the <strong>Lions</strong> 244 points ranks eighth<br />
overall in the NFL.<br />
¾ Over the past three seasons (2010-12), the <strong>Lions</strong> rank second<br />
in the NFL in Red Zone efficiency as the team has converted<br />
63.2-percent of its possessions in the Red Zone into touchdowns.