Beyond Borders: Global biotechnology report 2010
Beyond Borders: Global biotechnology report 2010
Beyond Borders: Global biotechnology report 2010

You also want an ePaper? Increase the reach of your titles
YUMPU automatically turns print PDFs into web optimized ePapers that Google loves.
explained by developments at a few<br />
large companies. Even after controlling<br />
for such impacts, the revenues of the<br />
industry grew at a markedly slower pace in<br />
2009 — reflecting, perhaps, a broader shift<br />
in market conditions.<br />
The cost-cutting and restructuring efforts of<br />
biotech companies also had a visible impact<br />
on the industry’s R&D spending and net<br />
income. As many biotech companies took<br />
extreme measures to reduce cash burn,<br />
R&D expenditures were often a casualty.<br />
After years of double-digit increases in R&D<br />
spending — which often grew at a faster<br />
clip than revenues — the industry’s R&D<br />
expenditures declined by 21% in 2009.<br />
Biotechnology is, of course, a researchdriven<br />
industry, and this is a potentially<br />
worrying development for the sector’s<br />
continued growth. In seeking short-term<br />
survival, some companies may be hurting<br />
their long-term prospects.<br />
Profitability, as many readers of <strong>Beyond</strong><br />
borders know, is a measure we have been<br />
tracking and forecasting for some time. In<br />
2005, we predicted that the US publicly<br />
traded industry would reach aggregate<br />
profitability by the end of the decade.<br />
Even as the US industry inched ever closer<br />
to that symbolic landmark with every<br />
successive year, the superheated M&A<br />
environment often took sizeable bites out<br />
of the sector’s net income, when several<br />
successful, profitable biotech firms were<br />
acquired by big pharma buyers. For a<br />
couple of years, the US industry hovered<br />
around the breakeven point, narrowly<br />
missing the profitability mark in 2007<br />
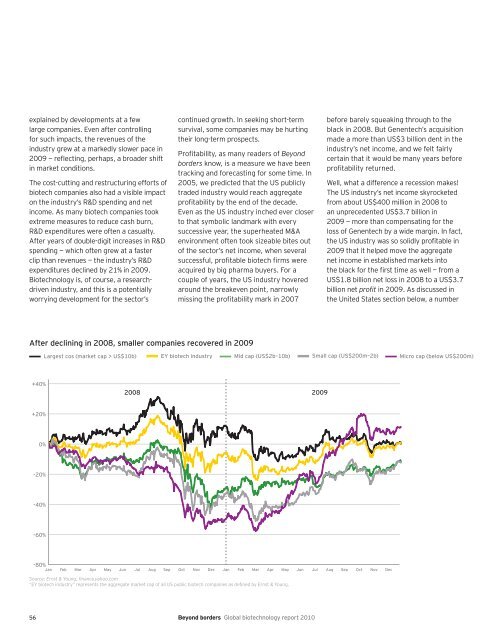
After declining in 2008, smaller companies recovered in 2009<br />
+40%<br />
+20%<br />
0%<br />
-20%<br />
-40%<br />
-60%<br />
2008 2009<br />
-80% Jan Feb Mar Apr May Jun Jul Aug Sep Oct Nov Dec Jan Feb Mar Apr May Jun Jul Aug Sep Oct Nov Dec<br />
Source: Ernst & Young, finance.yahoo.com<br />
“EY biotech industry” represents the aggregate market cap of all US public biotech companies as defined by Ernst & Young.<br />
56 <strong>Beyond</strong> borders <strong>Global</strong> <strong>biotechnology</strong> <strong>report</strong> <strong>2010</strong><br />
before barely squeaking through to the<br />
black in 2008. But Genentech’s acquisition<br />
made a more than US$3 billion dent in the<br />
industry’s net income, and we felt fairly<br />
certain that it would be many years before<br />
profitability returned.<br />
Well, what a difference a recession makes!<br />
The US industry’s net income skyrocketed<br />
from about US$400 million in 2008 to<br />
an unprecedented US$3.7 billion in<br />
2009 — more than compensating for the<br />
loss of Genentech by a wide margin. In fact,<br />
the US industry was so solidly profitable in<br />
2009 that it helped move the aggregate<br />
net income in established markets into<br />
the black for the first time as well — from a<br />
US$1.8 billion net loss in 2008 to a US$3.7<br />
billion net profit in 2009. As discussed in<br />
the United States section below, a number<br />
Largest cos (market cap > US$10b) EY biotech industry Mid cap (US$2b–10b) Small cap (US$200m–2b) Micro cap (below US$200m)