Beyond Borders: Global biotechnology report 2010
Beyond Borders: Global biotechnology report 2010
Beyond Borders: Global biotechnology report 2010

Create successful ePaper yourself
Turn your PDF publications into a flip-book with our unique Google optimized e-Paper software.
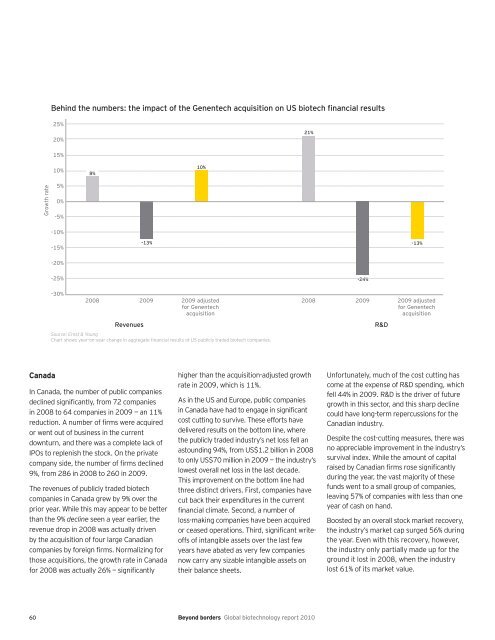
Growth rate<br />
Canada<br />
Behind the numbers: the impact of the Genentech acquisition on US biotech financial results<br />
25%<br />
20%<br />
15%<br />
10%<br />
5%<br />
0%<br />
-5%<br />
-10%<br />
-15%<br />
-20%<br />
-25%<br />
-30%<br />
8%<br />
-13%<br />
2008 2009 2009 adjusted<br />
for Genentech<br />
acquisition<br />
In Canada, the number of public companies<br />
declined significantly, from 72 companies<br />
in 2008 to 64 companies in 2009 — an 11%<br />
reduction. A number of firms were acquired<br />
or went out of business in the current<br />
downturn, and there was a complete lack of<br />
IPOs to replenish the stock. On the private<br />
company side, the number of firms declined<br />
9%, from 286 in 2008 to 260 in 2009.<br />
The revenues of publicly traded biotech<br />
companies in Canada grew by 9% over the<br />
prior year. While this may appear to be better<br />
than the 9% decline seen a year earlier, the<br />
revenue drop in 2008 was actually driven<br />
by the acquisition of four large Canadian<br />
companies by foreign firms. Normalizing for<br />
those acquisitions, the growth rate in Canada<br />
for 2008 was actually 26% — significantly<br />
higher than the acquisition-adjusted growth<br />
rate in 2009, which is 11%.<br />
As in the US and Europe, public companies<br />
in Canada have had to engage in significant<br />
cost cutting to survive. These efforts have<br />
delivered results on the bottom line, where<br />
the publicly traded industry’s net loss fell an<br />
astounding 94%, from US$1.2 billion in 2008<br />
to only US$70 million in 2009 — the industry’s<br />
lowest overall net loss in the last decade.<br />
This improvement on the bottom line had<br />
three distinct drivers. First, companies have<br />
cut back their expenditures in the current<br />
financial climate. Second, a number of<br />
loss-making companies have been acquired<br />
or ceased operations. Third, significant writeoffs<br />
of intangible assets over the last few<br />
years have abated as very few companies<br />
now carry any sizable intangible assets on<br />
their balance sheets.<br />
60 <strong>Beyond</strong> borders <strong>Global</strong> <strong>biotechnology</strong> <strong>report</strong> <strong>2010</strong><br />
10%<br />
2008 2009 2009 adjusted<br />
for Genentech<br />
acquisition<br />
Revenues R&D<br />
Source: Ernst & Young<br />
Chart shows year-on-year change in aggregate financial results of US publicly traded biotech companies.<br />
21%<br />
-24%<br />
-13%<br />
Unfortunately, much of the cost cutting has<br />
come at the expense of R&D spending, which<br />
fell 44% in 2009. R&D is the driver of future<br />
growth in this sector, and this sharp decline<br />
could have long-term repercussions for the<br />
Canadian industry.<br />
Despite the cost-cutting measures, there was<br />
no appreciable improvement in the industry’s<br />
survival index. While the amount of capital<br />
raised by Canadian firms rose significantly<br />
during the year, the vast majority of these<br />
funds went to a small group of companies,<br />
leaving 57% of companies with less than one<br />
year of cash on hand.<br />
Boosted by an overall stock market recovery,<br />
the industry’s market cap surged 56% during<br />
the year. Even with this recovery, however,<br />
the industry only partially made up for the<br />
ground it lost in 2008, when the industry<br />
lost 61% of its market value.