Numerical modeling of waves for a tsunami early warning system
Numerical modeling of waves for a tsunami early warning system
Numerical modeling of waves for a tsunami early warning system

You also want an ePaper? Increase the reach of your titles
YUMPU automatically turns print PDFs into web optimized ePapers that Google loves.
<strong>Numerical</strong> <strong>modeling</strong> <strong>of</strong> <strong>waves</strong> <strong>for</strong> a <strong>tsunami</strong> <strong>early</strong> <strong>warning</strong> <strong>system</strong><br />
<strong>for</strong> 360 ◦ is used to solve the MSEs in cylindrical coordinates. The reference<br />
origin r = 0 falls in the middle <strong>of</strong> the island, while θ = 0 is in corrispondence<br />
with the center <strong>of</strong> the wave maker boundary and points toward the direction<br />
<strong>of</strong> the radiated <strong>waves</strong>.<br />
In order to save computational time, given the model symmetry, only<br />
the upper half <strong>of</strong> the circular domain was reproduced. The elliptic MSEs<br />
are solved with the finite element method, as <strong>for</strong> the previously described<br />
experiments, and the linear elements have a maximum size <strong>of</strong> 0.5 m. The<br />
simulation which solves the elliptic MSE in the half circle <strong>of</strong> maximum radius<br />
<strong>of</strong> 150 m have around 605 kDOF and took about one minute to reproduce one<br />
wave frequency component on a AMD opteron 246 2GHz computer equipped<br />
with 4GB <strong>of</strong> RAM.<br />
real(A)<br />
abs(A)<br />
0.05<br />
0<br />
θ =0 ◦<br />
−0.05<br />
80 100 120 140<br />
angle(A)<br />
0.05<br />
0.04<br />
0.03<br />
0.02<br />
0.01<br />
80 100 120 140<br />
4<br />
2<br />
0<br />
−2<br />
−4<br />
80 100 120 140<br />
r<br />
0.05<br />
0<br />
θ = 180 ◦<br />
−0.05<br />
80 100 120 140<br />
0.05<br />
0.04<br />
0.03<br />
0.02<br />
0.01<br />
80 100 120 140<br />
4<br />
2<br />
0<br />
−2<br />
−4<br />
80 100 120 140<br />
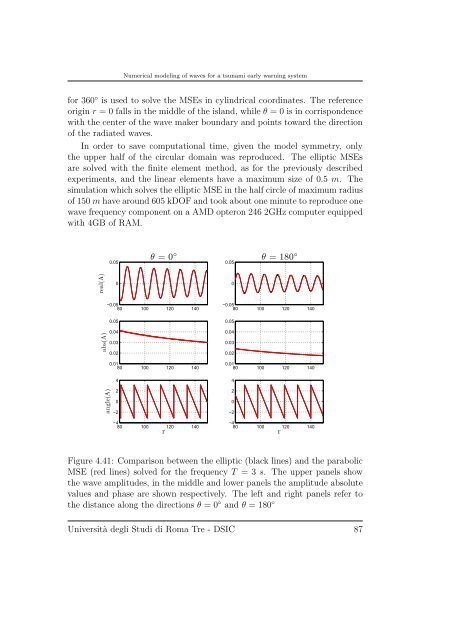
Figure 4.41: Comparison between the elliptic (black lines) and the parabolic<br />
MSE (red lines) solved <strong>for</strong> the frequency T =3s. The upper panels show<br />
the wave amplitudes, in the middle and lower panels the amplitude absolute<br />
values and phase are shown respectively. The left and right panels refer to<br />
the distance along the directions θ =0 ◦ and θ = 180 ◦<br />
Università degli Studi di Roma Tre - DSIC 87<br />
r