Numerical modeling of waves for a tsunami early warning system
Numerical modeling of waves for a tsunami early warning system
Numerical modeling of waves for a tsunami early warning system

You also want an ePaper? Increase the reach of your titles
YUMPU automatically turns print PDFs into web optimized ePapers that Google loves.
<strong>Numerical</strong> <strong>modeling</strong> <strong>of</strong> <strong>waves</strong> <strong>for</strong> a <strong>tsunami</strong> <strong>early</strong> <strong>warning</strong> <strong>system</strong><br />
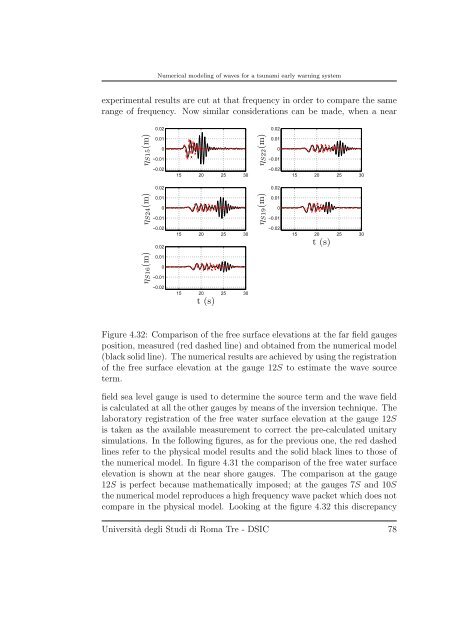
experimental results are cut at that frequency in order to compare the same<br />
range <strong>of</strong> frequency. Now similar considerations can be made, when a near<br />
ηS15(m)<br />
ηS24(m)<br />
ηS16(m)<br />
0.02<br />
0.01<br />
0<br />
−0.01<br />
−0.02<br />
0.02<br />
0.01<br />
0<br />
−0.01<br />
−0.02<br />
0.02<br />
0.01<br />
0<br />
−0.01<br />
−0.02<br />
15 20 25 30<br />
15 20 25 30<br />
15 20 25 30<br />
t(s)<br />
ηS22(m)<br />
ηS19(m)<br />
0.02<br />
0.01<br />
0<br />
−0.01<br />
−0.02<br />
0.02<br />
0.01<br />
0<br />
−0.01<br />
−0.02<br />
15 20 25 30<br />
15 20 25 30<br />
t(s)<br />
Figure 4.32: Comparison <strong>of</strong> the free surface elevations at the far field gauges<br />
position, measured (red dashed line) and obtained from the numerical model<br />
(black solid line). The numerical results are achieved by using the registration<br />
<strong>of</strong> the free surface elevation at the gauge 12S to estimate the wave source<br />
term.<br />
field sea level gauge is used to determine the source term and the wave field<br />
is calculated at all the other gauges by means <strong>of</strong> the inversion technique. The<br />
laboratory registration <strong>of</strong> the free water surface elevation at the gauge 12S<br />
is taken as the available measurement to correct the pre-calculated unitary<br />
simulations. In the following figures, as <strong>for</strong> the previous one, the red dashed<br />
lines refer to the physical model results and the solid black lines to those <strong>of</strong><br />
the numerical model. In figure 4.31 the comparison <strong>of</strong> the free water surface<br />
elevation is shown at the near shore gauges. The comparison at the gauge<br />
12S is perfect because mathematically imposed; at the gauges 7S and 10S<br />
the numerical model reproduces a high frequency wave packet which does not<br />
compare in the physical model. Looking at the figure 4.32 this discrepancy<br />
Università degli Studi di Roma Tre - DSIC 78