Numerical modeling of waves for a tsunami early warning system
Numerical modeling of waves for a tsunami early warning system
Numerical modeling of waves for a tsunami early warning system

Create successful ePaper yourself
Turn your PDF publications into a flip-book with our unique Google optimized e-Paper software.
<strong>Numerical</strong> <strong>modeling</strong> <strong>of</strong> <strong>waves</strong> <strong>for</strong> a <strong>tsunami</strong> <strong>early</strong> <strong>warning</strong> <strong>system</strong><br />
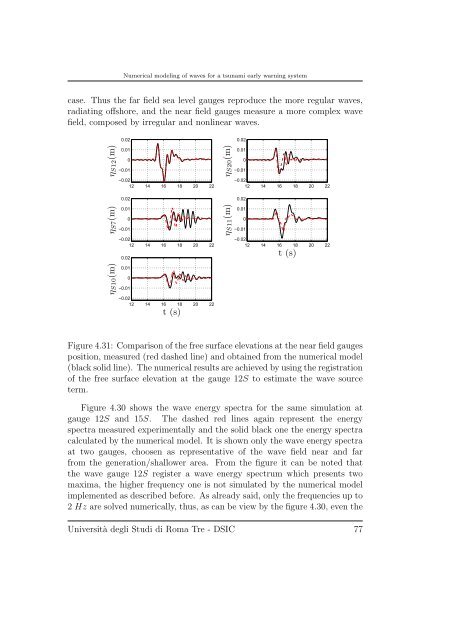
case. Thus the far field sea level gauges reproduce the more regular <strong>waves</strong>,<br />
radiating <strong>of</strong>fshore, and the near field gauges measure a more complex wave<br />
field, composed by irregular and nonlinear <strong>waves</strong>.<br />
ηS12(m)<br />
ηS7(m)<br />
ηS10(m)<br />
0.02<br />
0.01<br />
0<br />
−0.01<br />
−0.02<br />
12 14 16 18 20 22<br />
0.02<br />
0.01<br />
0<br />
−0.01<br />
−0.02<br />
12 14 16 18 20 22<br />
0.02<br />
0.01<br />
0<br />
−0.01<br />
−0.02<br />
12 14 16 18 20 22<br />
t(s)<br />
ηS20(m)<br />
ηS11(m)<br />
0.02<br />
0.01<br />
0<br />
−0.01<br />
−0.02<br />
12 14 16 18 20 22<br />
0.02<br />
0.01<br />
0<br />
−0.01<br />
−0.02<br />
12 14 16 18 20 22<br />
t(s)<br />
Figure 4.31: Comparison <strong>of</strong> the free surface elevations at the near field gauges<br />
position, measured (red dashed line) and obtained from the numerical model<br />
(black solid line). The numerical results are achieved by using the registration<br />
<strong>of</strong> the free surface elevation at the gauge 12S to estimate the wave source<br />
term.<br />
Figure 4.30 shows the wave energy spectra <strong>for</strong> the same simulation at<br />
gauge 12S and 15S. The dashed red lines again represent the energy<br />
spectra measured experimentally and the solid black one the energy spectra<br />
calculated by the numerical model. It is shown only the wave energy spectra<br />
at two gauges, choosen as representative <strong>of</strong> the wave field near and far<br />
from the generation/shallower area. From the figure it can be noted that<br />
the wave gauge 12S register a wave energy spectrum which presents two<br />
maxima, the higher frequency one is not simulated by the numerical model<br />
implemented as described be<strong>for</strong>e. As already said, only the frequencies up to<br />
2 Hz are solved numerically, thus, as can be view by the figure 4.30, even the<br />
Università degli Studi di Roma Tre - DSIC 77